Core Graphics Tutorial: Gradients and Contexts
In this Core Graphics tutorial, learn how to develop a modern iOS app with advanced Core Graphics features like gradients and transformations. By Fabrizio Brancati.
Clipping Areas
When you used the gradient just now, you filled the whole of the view’s context area. However, if you don’t want to fill an entire area, you can create paths to clip the drawing area.
To see this in action, go to GraphView.swift.
First, add these constants at the top of GraphView, which you’ll use for drawing later:
private enum Constants {
  static let cornerRadiusSize = CGSize(width: 8.0, height: 8.0)
  static let margin: CGFloat = 20.0
  static let topBorder: CGFloat = 60
  static let bottomBorder: CGFloat = 50
  static let colorAlpha: CGFloat = 0.3
  static let circleDiameter: CGFloat = 5.0
}
Now add this code to the top of draw(_:):
let path = UIBezierPath(
  roundedRect: rect,
  byRoundingCorners: .allCorners,
  cornerRadii: Constants.cornerRadiusSize
)
path.addClip()
This will create a clipping area that constrains the gradient. You’ll use this same trick later to draw a second gradient under the graph line.
Build and run and see that your Graph View has nice, rounded corners:
If you use Core Animation, you’ll use CALayer’s cornerRadius property instead of clipping. For a good tutorial on this concept, check out Custom Control Tutorial for iOS and Swift: A Reusable Knob, where you’ll use Core Animation to create a custom control.
draw(_:).
Calculating Graph Points
Now you’ll take a short break from drawing to make the graph. You’ll plot 7 points; the x-axis will be the “Day of the Week” and the y-axis will be the “Number of Glasses Drunk”.
First, set up sample data for the week.
Still in GraphView.swift, at the top of the class, add this property:
// Weekly sample data
var graphPoints = [4, 2, 6, 4, 5, 8, 3]
This holds sample data that represents seven days.
Add this code to the top of the draw(_:):
let width = rect.width
let height = rect.height
And add this code to the end of draw(_:):
// Calculate the x point

let margin = Constants.margin
let graphWidth = width - margin * 2 - 4
let columnXPoint = { (column: Int) -> CGFloat in
  // Calculate the gap between points
  let spacing = graphWidth / CGFloat(self.graphPoints.count - 1)
  return CGFloat(column) * spacing + margin + 2
}
The x-axis points consist of 7 equally spaced points. The code above is a closure expression. It could have been added as a function, but for small calculations like this, you can keep them in line.
columnXPoint takes a column as a parameter and returns a value where the point should be on the x-axis.
Add the code to calculate the y-axis points to the end of draw(_:):
// Calculate the y point

let topBorder = Constants.topBorder
let bottomBorder = Constants.bottomBorder
let graphHeight = height - topBorder - bottomBorder
guard let maxValue = graphPoints.max() else {
  return
}
let columnYPoint = { (graphPoint: Int) -> CGFloat in
  let yPoint = CGFloat(graphPoint) / CGFloat(maxValue) * graphHeight
  return graphHeight + topBorder - yPoint // Flip the graph
}
columnYPoint is also a closure expression that takes the value from the array for the day of the week as its parameter. It returns the y position, between 0 and the greatest number of glasses drunk.
Because the origin in Core Graphics is in the top-left corner and you draw a graph from an origin point in the bottom-left corner, columnYPoint adjusts its return value so that the graph is oriented as you would expect.
Continue by adding line drawing code to the end of draw(_:):
// Draw the line graph
UIColor.white.setFill()
UIColor.white.setStroke()
// Set up the points line
let graphPath = UIBezierPath()
// Go to start of line
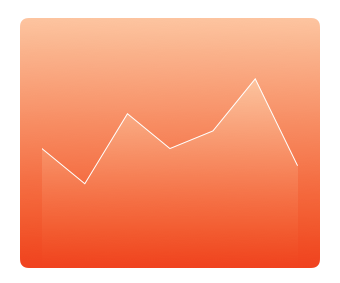
graphPath.move(to: CGPoint(x: columnXPoint(0), y: columnYPoint(graphPoints[0])))
// Add points for each item in the graphPoints array
// at the correct (x, y) for the point
for i in 1..<graphPoints.count {
let nextPoint = CGPoint(x: columnXPoint(i), y: columnYPoint(graphPoints[i]))
graphPath.addLine(to: nextPoint)
}
graphPath.stroke()
In this block, you create the path for the graph. The UIBezierPath is built from the x and y points for each element in graphPoints.
The Graph View in the storyboard should now look like this:
Now that you verified the line draws correctly, remove this from the end of draw(_:):
graphPath.stroke()
That was just so that you could check out the line in the storyboard and verify that the calculations are correct.
Creating the Gradient for the Graph
You're now going to create a gradient underneath this path by using the path as a clipping path.
First set up the clipping path at the end of draw(_:):
// Create the clipping path for the graph gradient
// 1 - Save the state of the context (commented out for now)
//context.saveGState()
// 2 - Make a copy of the path
guard let clippingPath = graphPath.copy() as? UIBezierPath else {
return
}
// 3 - Add lines to the copied path to complete the clip area
clippingPath.addLine(to: CGPoint(
x: columnXPoint(graphPoints.count - 1),
y: height))
clippingPath.addLine(to: CGPoint(x: columnXPoint(0), y: height))
clippingPath.close()
// 4 - Add the clipping path to the context
clippingPath.addClip()
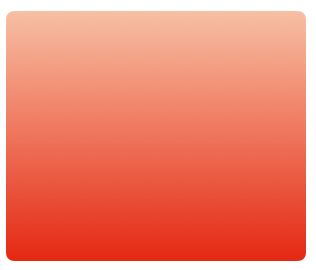
// 5 - Check clipping path - Temporary code
UIColor.green.setFill()
let rectPath = UIBezierPath(rect: rect)
rectPath.fill()
// End temporary code
In the code above, you:
- Commented out
context.saveGState()for now. You'll come back to this in a moment once you understand what it does. - Copy the plotted path to a new path that defines the area to fill with a gradient.
- Complete the area with the corner points and close the path. This adds the bottom-right and bottom-left points of the graph.
- Add the clipping path to the context. When the context is filled, only the clipped path is actually filled.
- Fill the context. Remember that
rectis the area of the context that was passed todraw(_:).
Your Graph View in the storyboard should now look like this:

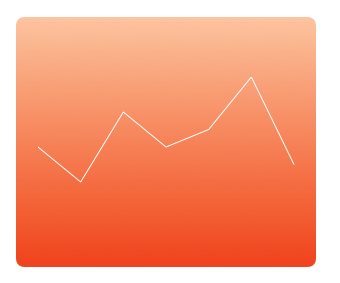
Next, you'll replace that lovely green with a gradient you create from the colors used for the background gradient.
Replace the temporary code under comment #5 with this code instead:
let highestYPoint = columnYPoint(maxValue)
let graphStartPoint = CGPoint(x: margin, y: highestYPoint)
let graphEndPoint = CGPoint(x: margin, y: bounds.height)

context.drawLinearGradient(
  gradient,
  start: graphStartPoint,
  end: graphEndPoint,
  options: [])
//context.restoreGState()
In this block, you find the highest number of glasses drunk and use that as the starting point of the gradient.
You can't fill the whole rect the same way you did with the green color. The gradient would fill from the top of the context instead of from the top of the graph, and the desired gradient wouldn't show up.
Take note of the commented out context.restoreGState(); you'll remove the comments after you draw the circles for the plot points.
At the end of draw(_:), add this:
// Draw the line on top of the clipped gradient
graphPath.lineWidth = 2.0
graphPath.stroke()
This code draws the original path.
Your graph is really taking shape now: