Navigating a New Codebase: Tips and tricks for getting up to speed quickly
Learn how to use view introspection and advanced coding techniques to help in navigating a new codebase. By Derek Selander.
Hunting for UIViews and Their Subclasses
Here’s the next ticket in your queue:
Ticket #2
UI Improvement: Change the color of the contents helper background from black to blue.
Make sure to use the predefined UIColor helper macro WMF_COLOR_BLUE (defined in WMF_Colors.h) when setting this particular color. In addition, change the bottom color from light gray to black.

Sometimes symbolic breakpoints don’t really help that much. You don’t know if the color above is set in Interface Builder or through code. Furthermore, if it is being set in code, you can’t really rely on a setBackgroundColor: symbolic breakpoint as this could be set through Core Graphics APIs. Trying to visually pair the code with the correct UIViewController in a storyboard isn’t really a viable option as it would be incredibly tedious given the size of the Wikipedia Storyboard file.
The best approach in this case is to find the name of the class which houses the color you want to change and work back from there. Knowing the name of the class helps you as you search through the .m file, and if it’s not found there, can still help you reduce time spent looking for the appropriate item in Interface Builder.
Both Reveal and View Debugging in Xcode 6 can help you associate what is happening on the Simulator or device with the UIView hierarchy in a visual manner. Although Reveal is a much better product, in this tutorial you’ll take advantage of the free Xcode 6 View Debugging feature.
Run the application in iOS 8 (device or simulator). Disclose the side menu by tapping the upper right navbar button with three uneven horizontal lines. Once it’s visible, go to the Xcode menu bar and choose Debug\View Debugging\Capture View Hierarchy. This suspends the process and displays the view hierarchy head-on. It will look something like this:

Click and drag to re-orient the view hierarchy into an exploded view. If you need to, use the provided controls to zoom in and out, pull the views farther apart, and filter the hierarchy to see only the subviews above or below a certain depth.
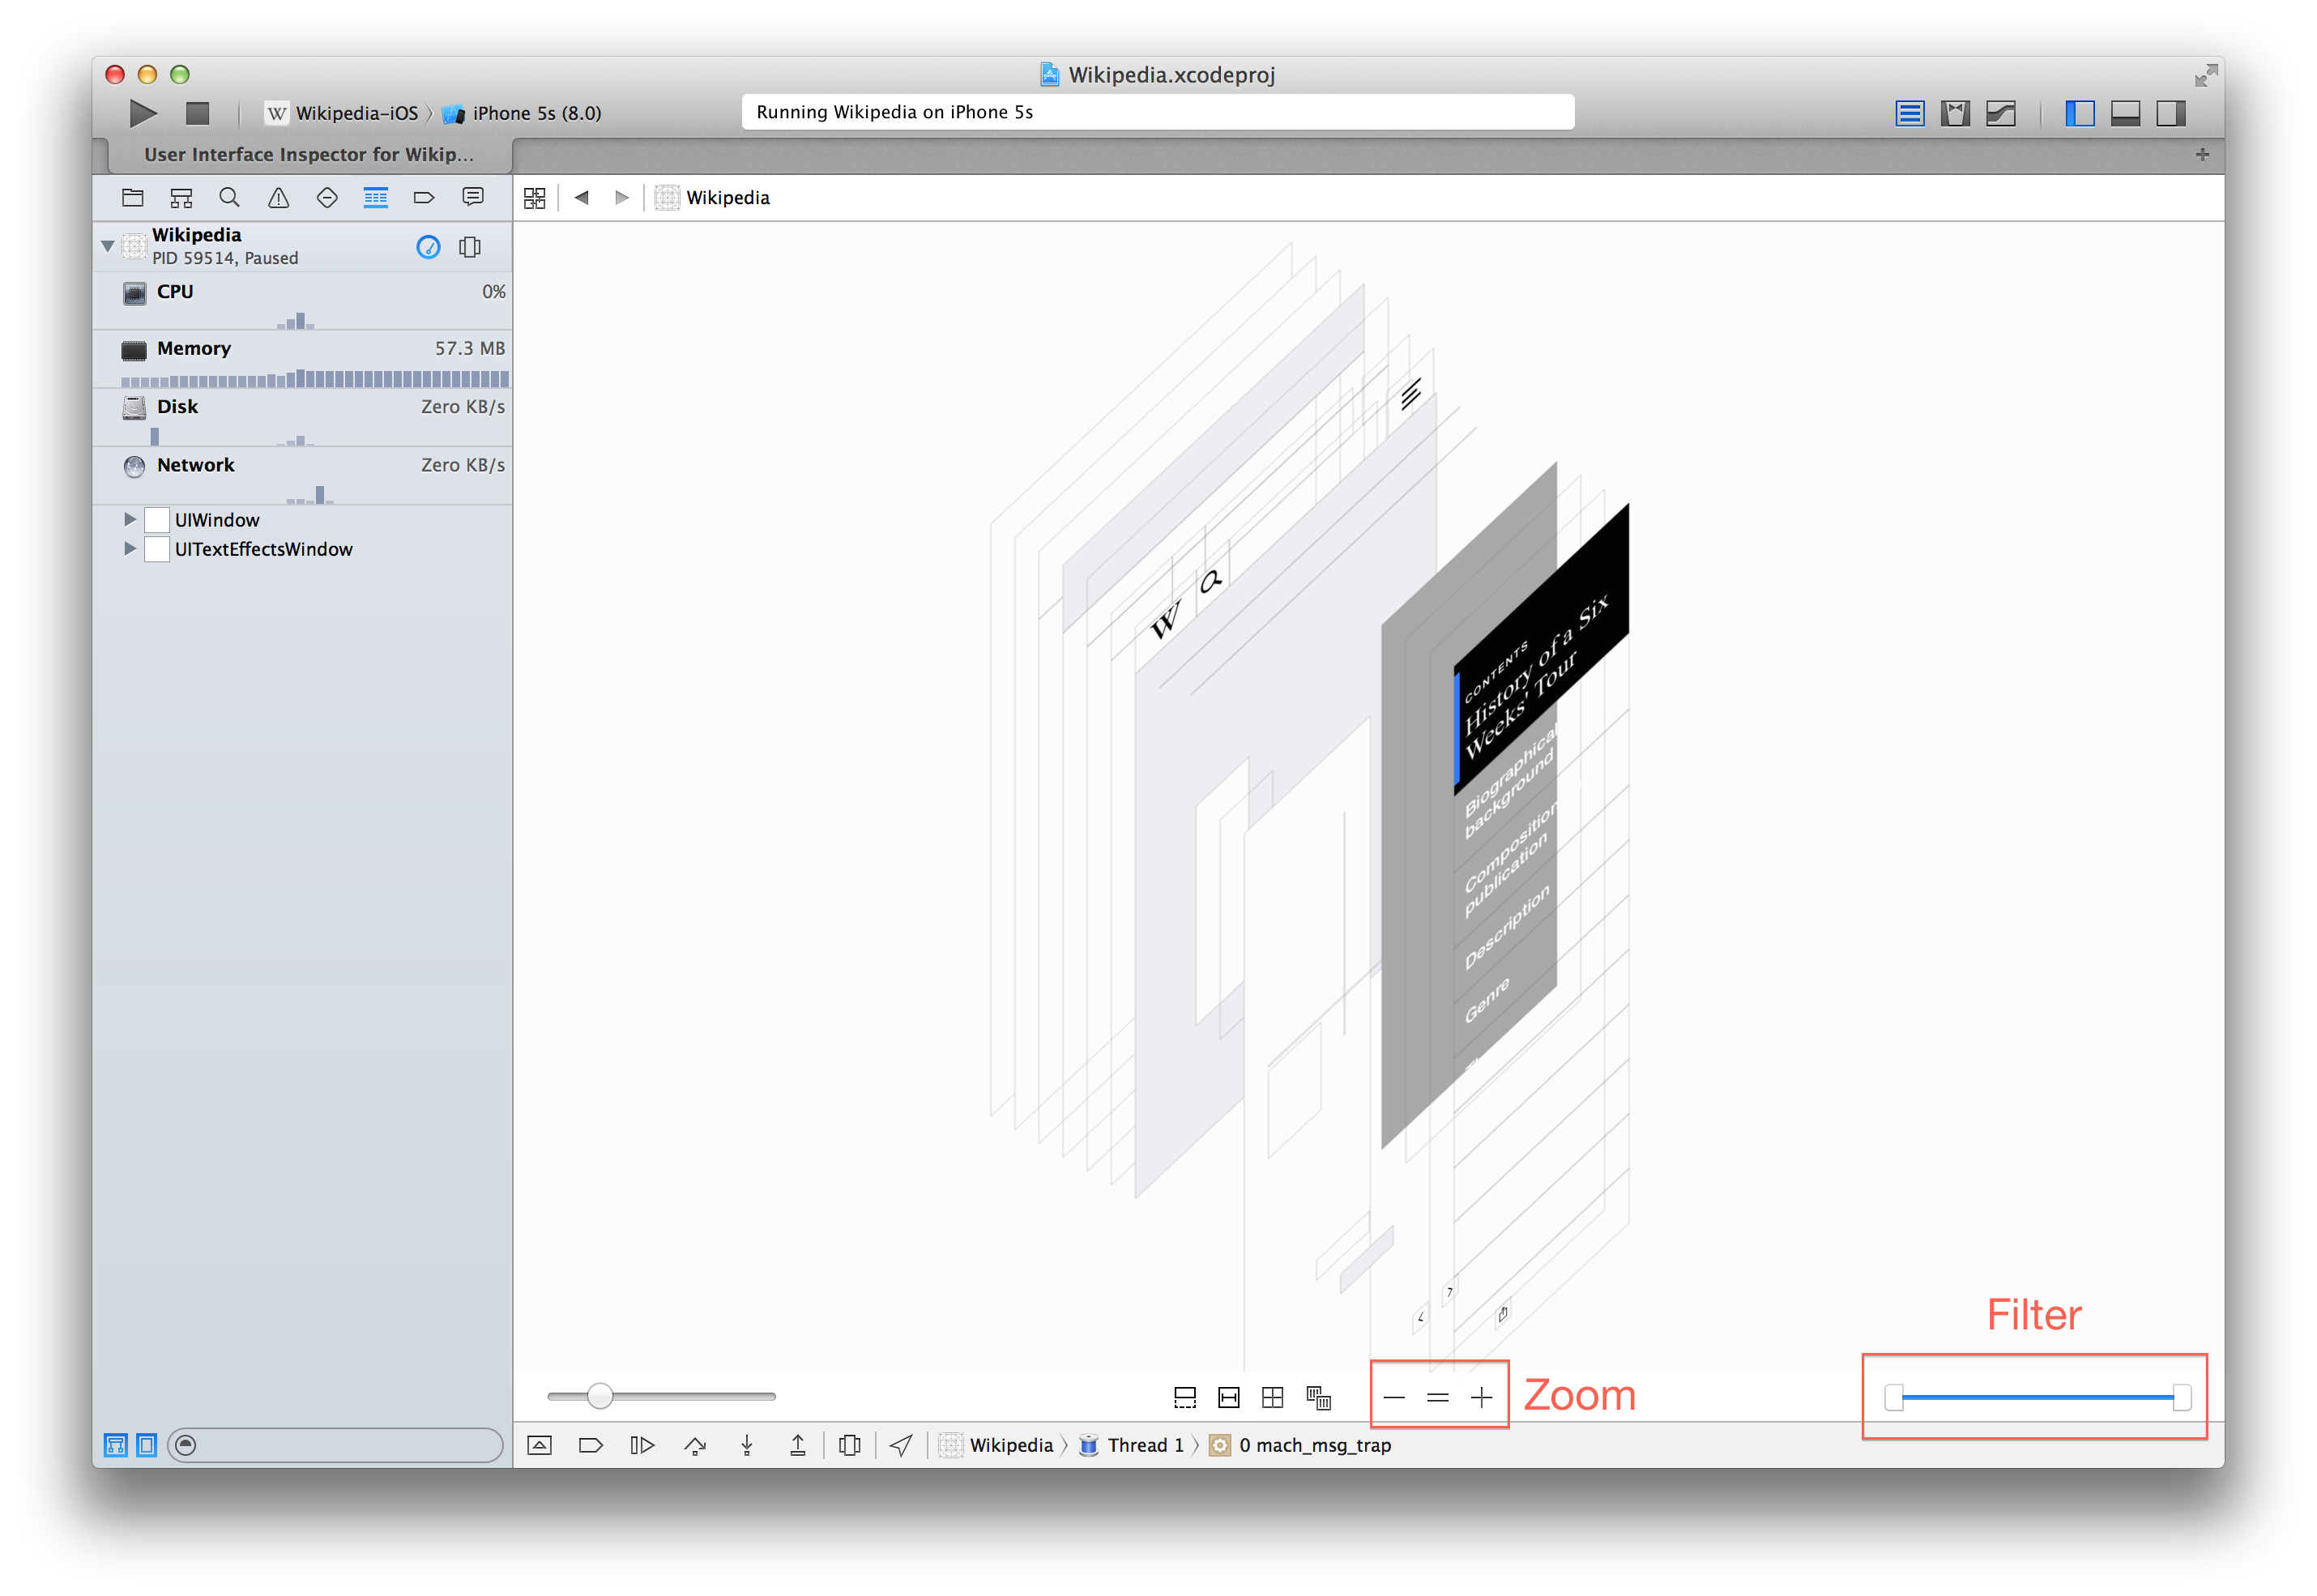
Provided that UIViews are subclassed, clicking on the views themselves will bring up the corresponding class names. Search through the views, and find the one you want to change — it has a black background color. Once you’ve located the view, press ⌘+Option+3 to ensure you’re using the Object Inspector.

- The view to search for and click on.
- The object inspector tab.
- The view’s class name and address of the instance.
The view’s name is TOCSectionCellView, so open TOCSectionCellView.m and see if you can find the logic that sets the background color in this cell and change it to WMF_COLOR_BLUE. You can check your work against the solution below.
[spoiler title=”Solution”]
The code of interest is on line 41. Change the line to:
if (self.isLead) self.backgroundColor = WMF_COLOR_BLUE;
[/spoiler]
Build and run your application; follow the reproduction steps in the ticket to see that your changes worked.
It looks like you can use same View Debugging trick described to hunt down the bottom gray portion that needs to be changes. Or can you?
Try it — you’ll quickly find out that you’re looking at a view that belongs to a UIViewController, and as a result, is nameless since there is no subclass for the UIView itself.
As you can see, hunting down UIViews might not be enough. This is when you’ll want to find the UIViewController associated with the UIView in the view hierarchy.
Debugging View Controllers Using Method Swizzling
Since there is no reference linking the UIView back to the corresponding UIViewController subclass, you can’t look this up directly via the debugger even though you’ve identified the exact UIView instance of interest. What you really need here is for every UIView to have a property that points to its view controller, and for every UIViewController to initialize that property on its view.
Fortunately, this is completely achievable! You can create a new property for an instance of UIView using an Associated Object and inject the initialization logic for that property into one of UIViewController’s instantiation methods using Method Swizzling.
This results in all UIView references having a property that points back to the original UIViewController. Although all UIViews will inherit this property, it will only be initialized for those UIViews that belong to a UIViewController.
To solve this problem, you’ll implement a UIViewController category to show you the corresponding UIVIewController.
In Xcode, click File\New\File\iOS\Objective C File and then click Next. Name it DebuggingViewInjector. Enter Category for the File Type and UIViewController for Class. Also ensure you check the Wikipedia target when prompted to make sure this category gets compiled into the binary.
Open UIViewController+DebuggingViewInjector.m and replace its contents with the following code:
#import <objc/runtime.h> // 1
#import "UIViewController+DebuggingViewInjector.h"
@implementation UIViewController (DebuggingViewInjector)

+ (void)load { // 2
    static dispatch_once_t onceToken;
    dispatch_once(&onceToken, ^{ // 3
        Class class = [self class];

        SEL originalSelector = @selector(viewDidLoad); // 4
        SEL swizzledSelector = @selector(customInjectionViewDidLoad); // 5

        Method originalMethod = class_getInstanceMethod(class, originalSelector); // 6
        Method swizzledMethod = class_getInstanceMethod(class, swizzledSelector);

        method_exchangeImplementations(originalMethod, swizzledMethod); // 7
    });
}

- (void)customInjectionViewDidLoad // 8
{
    self.view.debugVC = self; // 9
    [self customInjectionViewDidLoad]; // 10
}

@end
Here’s what’s going on in the code above:
- Make sure you import the runtime headers used to perform this dark and powerful sorcery.
- This is the
loadclass method. This is called when the class is loaded into the runtime. It’s a great place to do swizzling so that the method is swizzled before the class is ever used. - Since the
loadmethod can be invoked multiple times due to inheritance, you only want the swizzling to occur once. - The SEL variable is basically the string representation of your method. You will be injecting code into the
viewDidLoadmethod. - With the SEL variables, you will get the method implementations of the original and newly defined method.
- Fetch the implementations of the two methods that need to be swapped.
-
method_exchangeImplementationsswaps the original method with the new one. - This is the new method you’re swapping in for the original
viewDidLoadmethod. - Here you set a new
UIViewproperty you’ll use shortly. - Sharp-eyed readers will note that this looks like it will result in an infinite loop. But since you swapped the method implementations by the time this method runs, this line of code actually calls the original
viewDidLoad.
Your code has been injected into each -[UIViewController viewDidLoad] method, but this code won’t compile right now, because UIView doesn’t have a debugVC property.
Add the following code in front of the code you just added above, before the @implementation UIViewController (DebuggingViewInjector) line:
static char kWeakLinkViewControllerKey; // 1

@interface UIView ()
@property (nonatomic, unsafe_unretained) UIViewController *debugVC; // 2
@end

@implementation UIView (ViewControllerLinker)

- (void)setDebugVC:(UIViewController *)debugVC // 3
{
    objc_setAssociatedObject(self, &kWeakLinkViewControllerKey, debugVC, OBJC_ASSOCIATION_ASSIGN); // 4
}

- (UIViewController *)debugVC // 5
{
    return objc_getAssociatedObject(self, &kWeakLinkViewControllerKey); // 6
}

@end
Taking each numbered comment in turn:
- Each associated object requires a unique identifier. This defines a static variable that can be used as the identifier for our associated object.
- This declares the
debugVCproperty. It’s unsafe-unretained because you don’t want to hold a strong reference otherwise there would be a retain cycle (view controller owns view which owns the view controller). You’re actually going to override both the getter and setter, so the semantics described by the property are merely a note to the consumer. - This is the setter for the property.
- This code sets the associated object. Notice the OBJC_ASSOCIATION_ASSIGN. This defines the `unsafe_unretained` semantics that we described in the property. Sadly there is no way to do a nilling, weak reference with associated objects.
- This is the getter for the property.
- Fetch the value of the property from the associated object.
Finally, it would be smart to conditionally compile this code when you’re in DEBUG mode.
Surround the entire file — even the #import headers — with the following:
#if DEBUG
    // Original code
#endif
Now it’s time to give this bad-boy category a whirl. Build and run your app; navigate to the part of the app where you previously performed the View Debugging.
Enable the View Debugging using Debug\View Debugging\Capture View Hierarchy. Once the views generate, find the backing view for the side control that holds the gray color. Keep clicking back further and further to hunt down the root UIView that holds all subviews.
When you click on the correct UIView, you’ll see the memory address holding the UIView instance appear in the Utility Area of Xcode. Copy this address to the clipboard, then open up the Xcode console.

Type the following commands in lldb:
po [YOURMEMORYADDRESSHERE debugVC]
The console will spit out the resulting viewcontroller that is responsible for that UIView; in this case, it’s TOCViewController.
Open TOCViewController.m in Xcode. Try to find the logic that references a gray color in TOCViewController.m and change it to black. Check your findings against the solution below.
[spoiler title=”Solution”]It’s a trap! There is no code responsible for the gray color. You need to look at the corresponding UIViewController in the storyboard instead.[/spoiler]
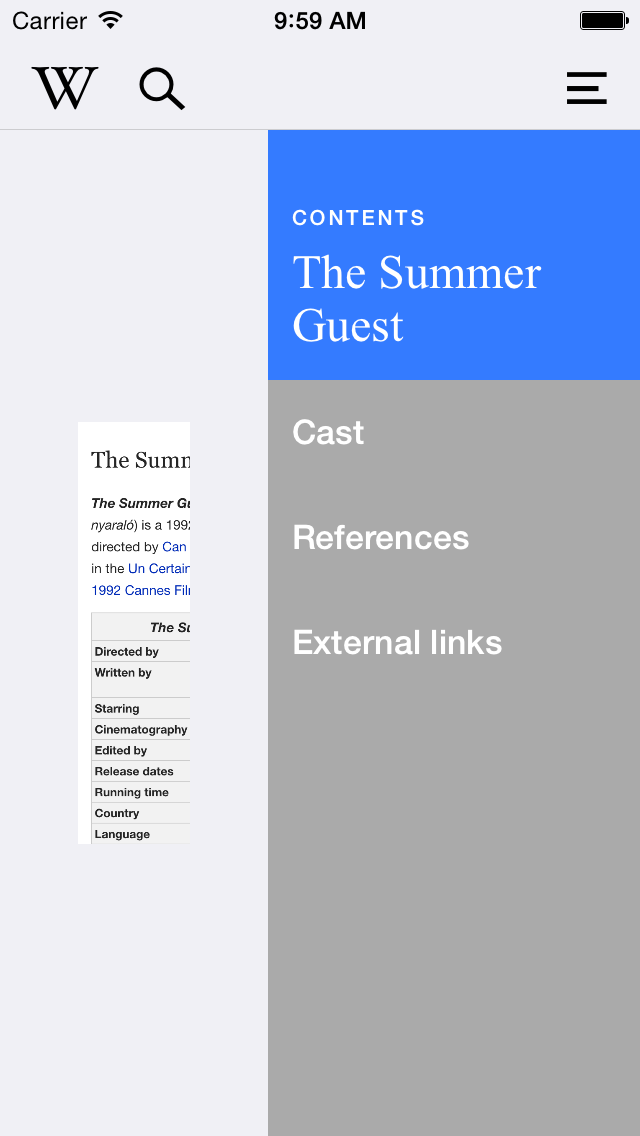
Press Ctrl+1 and select User Interface to bring up the file that holds the visual representation of TOCViewController. Use the Search bar in Interface Builder to find TOCViewController, then hunt down the appropriate UIView with the light gray color and change it to black.
Build & run and then navigate to the sidebar again. You should see something like this:
