Navigating a New Codebase: Tips and tricks for getting up to speed quickly
Learn how to use view introspection and advanced coding techniques to help in navigating a new codebase. By Derek Selander.
Seeing how Views are Assembled
When view controllers are sensibly named, you can pretty much guess where they appear in the UI and how they’re created. View controllers can be created from NIBs, from Storyboards, or entirely from code. A primitive yet effective way to find the view controllers is to search the codebase for these assets and inspect the results.
Ensure you’re in the Project Navigator tab; if not, press, ⌘+1 to get there quickly. In the lower left corner of the Project Navigator panel, type .xib into the search field and a handful of NIBs will show up. Take a look at each one in Interface Builder; these NIBs seem like they’re designed for UIViews or UITableViewCells, not UIViewControllers.
Perhaps the views you’re looking for live in Storyboards instead. Enter .storyboard in the search bar. Only one item shows up: Main_iPhone.storyboard. Open that file — is there anything of value inside?
Jackpot! This Storyboard houses the majority of the UIViewControllers in this app. Revisit this file if you need to associate a given view controller in the UI with it’s class.
Finally, go to the find navigator (⌘+3) and search for ViewController. Since this codebase has a regular naming convention, the search results highlight code with numerous view controller subclasses. These results don’t provide the valuable instant navigation overview of a Storyboard file, but they might help you never-the-less.
Mapping the Code With Symbolic Breakpoints
Now that you have a basic understanding of the view controllers used in this app, your next step is to see which view controllers pop up when the app runs.
Open up the Debug Navigator — ⌘+7 is a handy shortcut. Click on the + at the bottom left of the screen and then select Add Symbolic Breakpoint…. Type in viewDidLoad; this places a breakpoint in every object that holds a viewDidLoad method.
The image below shows you how to set up this breakpoint.
This breakpoint will help you map which view controllers run when you exercise the app. Every time a view controller loads its view, the app will pause execution and you’ll be able to see the view controller’s name in the main thread stack in the Debug Navigator.
If the view is defined in the code itself, you’ll see the code itself in the editor pane; when it’s Apple’s own framework code, as happens in every call to the UIViewController superclass, you’ll only see an assembly listing.
Launch the app again with the symbolic breakpoint enabled. Although your progress through the app will be a lot slower, this is a good way to get a list of view controllers used when the app starts. If you get tired of hunting for the button to continue debug execution, use Ctrl+⌘+Y to speed things along.
What view controllers pop up when you run the app? Check your results against the list below.
[spoiler title=”Solution”]
- OnboardingViewController (If this is a first time run)
- TopMenuViewController
- CenterNavController
- RootViewController
- BottomMenuViewController
- WebViewController (PullToRefreshViewController superclass)
[/spoiler]
Now that you’ve gained a bit of knowledge about the app, you can tackle your first ticket!
Ticket #1
Bug: The navbar displays content underneath the status bar when saving content.
QA Helper note: this problem is due to the prefersStatusBarHidden property of UIViewController. Because it is currently set to YES, the view controller is positioning the controls incorrectly. Override this method to NO in the appropriate view controller.
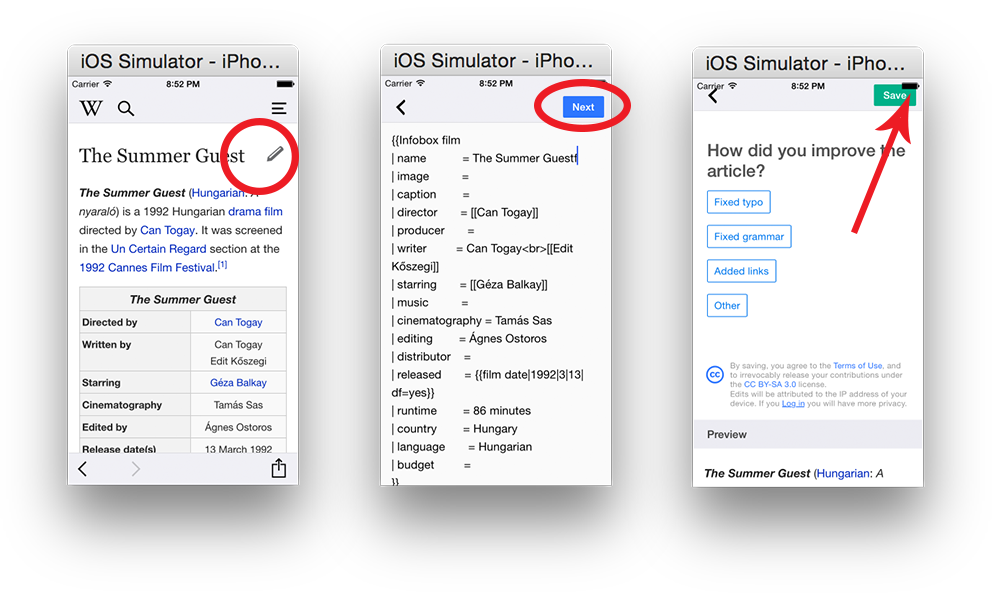
- Navigate to a wiki page. Press the edit button in any section.
- Change some content in the textview then press the Next button.
- Content appears underneath the status bar like so:
For this particular case, you know from the detailed ticket exactly what to do; you just don’t know where to do it. You could, of course, find the view controller’s name by examining the Storyboard, but that would take too long. Instead, you should let the debugger notify you when the appropriate UIViewController loads — that’s your clue that this is probably the view controller you need to modify.
Follow the reproduction steps in the ticket; run up the Simulator and edit a page, but stop just before you press the Next button. Make sure the viewDidLoad breakpoints are enabled. If you don’t want to slog through all of the breakpoints, you can use ⌘+Y to toggle all breakpoints on and off.
Click the Next button in the Simulator, and wait for the debugger to hit the breakpoint. You’ve stopped on a view controller, but is it the right one?
Press Ctrl+6 to bring up the function list, type in prefersStatusBarHidden then press Enter. You’ve stopped at the CaptchaViewController, but this view controller’s prefersStatusbarHidden already returns NO — you’re not there yet.
Continue execution to the next breakpoint. Once you reach PreviewAndSaveViewController, check prefersStatusbarHidden. Does it return YES? Yup, it does — you’ve found the culprit.
To fix the issue, replace the prefersStatusBarHidden method with the following code:
- (BOOL)prefersStatusBarHidden
{
    return NO;
}
Build and run your app; test your changes to make sure that your changes worked as expected. Go through the same steps that you went through when reproducing the bug. You should now see something like this on the final screen:

Symbolic breakpoints can really shine when you are trying to find a known method of an unknown class. Good knowledge of the iOS SDK and delegate methods can help you quickly hunt down an item of interest in a new codebase.
In addition, symbolic breakpoints can be surprisingly helpful when debugging properties. For instance, a property called isHidden has both a getter and a setter. You can instruct the debugger to stop only when the property is set by using setIsHidden:. This is ideal for classes whose instances interact with many different classes — such as singletons — and that have public properties which are being modified.
You’ve learned how to find the code behind a view using symbolic breakpoints. Next, you’ll learn how to do the same thing through inspecting the view itself.