Core Plot Tutorial: Getting Started
In this Core Plot tutorial you’ll learn how to plot your data on beautiful pie and scatter charts using Swift and the open source Core Plot framework. By Attila Hegedüs.
3.7 (3) · 1 Review
Grinding Axes
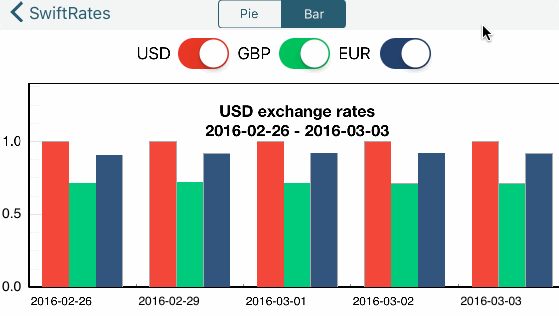
Much better, right? The only drawback is that your axes are plain – giving no idea of the exact exchange rate.
You can fix this so that when a user taps on an individual bar chart, the app will display the price that the bar represents. To do this, add a new property:
var priceAnnotation: CPTPlotSpaceAnnotation?
Then add the following code to barPlot(for:barWasSelectedAtRecord:with:):
// 1 - Is the plot hidden?
  if plot.isHidden == true {
    return
  }
  // 2 - Create style, if necessary
  let style = CPTMutableTextStyle()
  style.fontSize = 12.0
  style.fontName = "HelveticaNeue-Bold"

  // 3 - Create annotation
  guard let price = number(for: plot,
                           field: UInt(CPTBarPlotField.barTip.rawValue),
                           record: idx) as? CGFloat else { return }

  priceAnnotation?.annotationHostLayer?.removeAnnotation(priceAnnotation)
  priceAnnotation = CPTPlotSpaceAnnotation(plotSpace: plot.plotSpace!, anchorPlotPoint: [0,0])

  // 4 - Create number formatter
  let formatter = NumberFormatter()
  formatter.maximumFractionDigits = 2
  // 5 - Create text layer for annotation
  let priceValue = formatter.string(from: NSNumber(cgFloat: price))
  let textLayer = CPTTextLayer(text: priceValue, style: style)

  priceAnnotation!.contentLayer = textLayer
  // 6 - Get plot index
  var plotIndex: Int = 0
  if plot == plot1 {
    plotIndex = 0
  }
  else if plot == plot2 {
    plotIndex = 1
  }
  else if plot == plot3 {
    plotIndex = 2
  }
  // 7 - Get the anchor point for annotation
  let x = CGFloat(idx) + CGFloat(BarInitialX) + (CGFloat(plotIndex) * CGFloat(BarWidth))
  let y = CGFloat(price) + 0.05
  priceAnnotation!.anchorPlotPoint = [NSNumber(cgFloat: x), NSNumber(cgFloat: y)]
  // 8 - Add the annotation
  guard let plotArea = plot.graph?.plotAreaFrame?.plotArea else { return }
  plotArea.addAnnotation(priceAnnotation)
}
This requires a bit of explanation:
- You don’t display an annotation for a hidden plot. While the plots currently don’t have the ability to be hidden, you’ll be implementing this in the next step when you integrate the switches with the chart.
- Here you create a text style for your annotation.
- You then get the price for the specified plot and then create an annotation object if one doesn’t exist.
- You create a number formatter if one doesn’t exist, since you’ll need to format the price for display.
- You create a text layer using the formatted price, and set the content layer for the annotation to this new text layer.
- You get the plot index for the plot for which you’ll display the annotation.
- You calculate the annotation position based on the plot index, and then set the
anchorPlotPointfor the annotation using the calculated position. - Finally, you add the annotation to the graph.
Build and run. Every time you tap on a bar in your chart, the value for that bar should pop up right above the bar.
Nifty! :]

Hide and Seek
The bar graph looks great, but the switches at the top of the screen do nothing. It’s time in this Core Plot tutorial to rectify that.
First, you’ll need to add a helper method. Add the following right after switch3Changed(_:):
func hideAnnotation(graph: CPTGraph) {
  guard let plotArea = graph.plotAreaFrame?.plotArea,
    let priceAnnotation = priceAnnotation else {
      return
  }
  plotArea.removeAnnotation(priceAnnotation)
  self.priceAnnotation = nil
}
The code simply removes an annotation, if it exists.
Next, you want the user to be able to toggle the display of bar charts for a given currency using the switches.
To do such, replace the implementations for switch1Changed(_:), switch2Changed(_:), and switch3Changed(_:) with the following:
@IBAction func switch1Changed(_ sender: UISwitch) {
  let on = sender.isOn
  if !on {
    hideAnnotation(graph: plot1.graph!)
  }
  plot1.isHidden = !on
}

@IBAction func switch2Changed(_ sender: UISwitch) {
  let on = sender.isOn
  if !on {
    hideAnnotation(graph: plot2.graph!)
  }
  plot2.isHidden = !on
}

@IBAction func switch3Changed(_ sender: UISwitch) {
  let on = sender.isOn
  if !on {
    hideAnnotation(graph: plot3.graph!)
  }
  plot3.isHidden = !on
}
The logic is fairly simple. If the switch is set to off, the corresponding plot and any visible annotation is hidden. If the switch is set to on, then the plot is made visible again.
Build and run. You can now toggle each bar chart to your heart’s content. Nice work on this Core Plot tutorial!
Where to Go From Here?
You can download the completed project from here.
Whew- that was fun! Hopefully, this Core Plot tutorial underscores the power of Core Plot and gives you ideas for how it can be used within your own apps.
Be sure to refer to the Core Plot repo for more information, including documentation, examples, and tips.
Also, if you have any questions or comments about this Core Plot tutorial, please join the forum discussion below.
Happy plotting!