Beginning Data Science with Jupyter Notebook and Kotlin
This tutorial introduces the concepts of Data Science, using Jupyter Notebook and Kotlin. You’ll learn how to set up a Jupyter notebook, load krangl for Kotlin and use it in data science utilizing a built-in sample data. By Joey deVilla.
Sorting Data
One of the simplest and most effective ways to make sense of a dataset is to sort it. Sorting data by one or more criteria makes it easier to see progressions and trends, determine the minimums and maximums for specific variables in your observations and spot outliers.
DataFrame’s sortedBy() method takes one or more column names as its arguments and returns a new data frame whose contents are sorted by the specified columns in the given order.
With sleepData, it would be beneficial to have a data frame where the animals are sorted by the number of hours they sleep each day, from least to most. The sleep_total column contains those values.
Enter the following into a new code cell:
sleepData.sortedBy("sleep_total")
You’ll see these results:
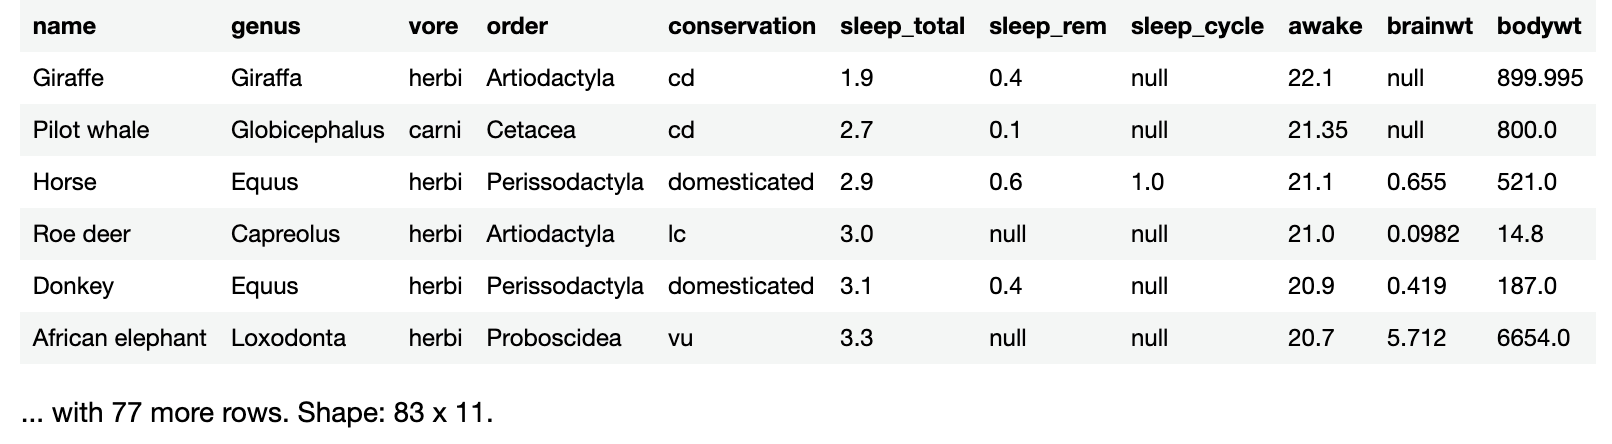
Sorting by hours of sleep per day makes it easy to see that the giraffe, an easily-spotted animal living among many predators, gets the least sleep.
Look a little farther down the data frame. Display rows 10 through 15 by running the following in a new code cell:
sleepData.sortedBy("sleep_total").slice(10..15)
Note that you’re using method chaining in the code above to produce a sorted data frame, and then get a smaller data frame made up of rows 10 through 15.
This is what you’ll see:

If you look at the rows for Goat and Tree hyrax, you’ll see that they both sleep 5.3 hours a day. The bodywt column, which shows body weight, also shows that goats are considerably larger than tree hyraxes, but the goat is first in the list.
Look a little further down the data frame with this code:
sleepData.sortedBy("sleep_total").slice(16..20)
This will display the next few rows:

The same situation with the goat and tree hyrax happens in the Gray hyrax and Genet rows. Both sleep for the same amount of time, and the heavier animal first in the list.
To deliberately sort the animals first by sleep time and then by body weight, you provide the names of those columns in that order. Run the following in a new code cell:
sleepData.sortedBy("sleep_total", "bodywt")
This time, the resulting table shows the animals sorted by the number of hours they sleep each day, from least to most. Where any animals sleep the same amount of time, the list will show them from lightest to heaviest.
sortedBy() has a counterpart, sortedByDescending(), which takes one or more column names as its arguments and returns a new data frame whose contents are sorted by the specified columns in the given order in descending order.
To see the animals listed in order from those who sleep the most to sleep the least, run the following in a new code cell:
sleepData.sortedByDescending("sleep_total")
The first two rows should show that of the 83 species in the dataset, brown bats sleep the most…almost 20 hours a day. I bet you wish you were a brown bat right now!
Filtering
Another key data operation is picking out only those observations whose variables meet specific criteria. This lets you focus on a section of the dataset or perhaps rule out outliers or other data you want to disqualify.
DataFrame provides the filter() method, which lets you specify columns and criteria for the columns’ values. Using these columns and criteria filter() creates a new data frame containing only rows whose column values meet the given criteria.
Filtering is a little easier to explain by example rather than describing it.
Learning the Basics of Filtering
Try creating new datasets based on animals in sleepData that meet certain criteria.
Suppose you want to look at the data for herbivores — animals that eat only plants. You can tell the type of food each animal eats by looking at the vore column. If you look at the first three animals in the list by running sleepData.head(3), you’ll see that the cheetah is a carnivore, the owl monkey is an omnivore, and the mountain beaver is a herbivore.
Create a herbivore-only data frame by running this code in a new code cell:
val herbivores = sleepData.filter { it["vore"] isEqualTo "herbi" }
println("This dataset has ${herbivores.nrow} herbivores.")
herbivores
You’ll see the following output:

This dataset has 32 herbivores.
Both the println() function and the metadata below the table inform you that the new data frame, herbivores, has 32 rows. That’s considerably fewer rows than sleepData, which contains 83.
filter() takes a single argument: A lambda that acts as the criteria for which rows should go into the new data frame. Let’s take a closer look at that lambda:

- When a lambda has a single parameter, you can reference that parameter using the implicit built-in name;
it. In this case,itcontains a reference to thesleepDatadata frame. - Since
itrefers tosleepData,it["vore"]is a reference to aDataColinstance — a data frame column. In this case, it’s thevorecolumn. -
isEqualTois a method ofDataCol. Given a column and a comparison value, it returns aBooleanArraywith as many elements as the column has rows. For each row in the column, the element containstrueif the value in the row matches the comparison value; otherwise it containsfalse. Note thatisEqualTois an infix function, which allows you to call it using the syntaxit["vore"] isEqualTo "herbi"instead of using the standard syntax ofit["vore"].isEqualTo("herbi"). The infix syntax feels more like natural language, but you can also use the standard syntax if you prefer. -
filter()uses theBooleanArrayproduced by the lambda to determine which rows from the original data frame go into the resulting data frame. A row that has a corresponding true element in theBooleanArraywill appear in the resulting data frame.
It’s time to do a little more filtering.
Suppose you want to create a new dataset consisting of only the herbivores with a bodyweight of 200 kilograms (441 pounds) or more. Do this by running the following in a new code cell:
val heavyHerbivores = herbivores.filter { it["bodywt"] ge 200 }
heavyHerbivores
Note that this time, the comparison function in the lambda is ge, which is short for “greater than or equal to”. Here’s a quick list of the numeric comparison functions that you can use in a filter() lambda and when to use them:
-
eqorisEqualTo: When you want to create a filter so that the resulting dataset contains only rows where the data in the given column is equal to the given value. -
ge: When you want to create a filter so that the resulting dataset contains only rows where the data in the given column is greater than or equal to the given value. -
gt: When you want to create a filter so that the resulting dataset contains only rows where the data in the given column is greater than the given value. -
le: When you want to create a filter so that the resulting dataset contains only rows where the data in the given column is less than or equal to the given value. -
lt: When you want to create a filter so that the resulting dataset contains only rows where the data in the given column is less than the given value.
isEqualTo instead of == or ge instead of <=, it’s because isEqualTo and ge are actually infix methods of DataCol, the data column class, not operators.
The resulting data frame, heavyHerbivores, contains only 6 rows:

If you look at the sleep_total column, you’ll see that the best-rested of the bunch is the Brazilian tapir, which gets just over 4 hours of sleep a day. It seems that larger herbivores don’t sleep much, probably because they’re prime targets for predators. This is the kind of insight that you can get from judicious filtering.