Beginning Data Science with Jupyter Notebook and Kotlin
This tutorial introduces the concepts of Data Science, using Jupyter Notebook and Kotlin. You’ll learn how to set up a Jupyter notebook, load krangl for Kotlin and use it in data science utilizing a built-in sample data. By Joey deVilla.
Summarizing
Summarizing is the act of applying calculations to a grouped data frame on a per-group basis. Calculate sleep statistics for the grouped data frame.
Run the following code in a new code cell:
groupedData
 .summarize(
 "Mean daily total sleep (hours)" to { it["sleep_total"].mean(removeNA=true) },
 "Mean daily REM sleep (hours)" to { it["sleep_rem"].mean(removeNA=true) }
 )
The output, as the summarize() method name suggests, is a nice summary:

Now, improve on the summary by sorting it.
Run the following in a new code cell:
groupedData
 .summarize(
 "Mean daily total sleep (hours)" to { it["sleep_total"].mean(removeNA=true) },
 "Mean daily REM sleep (hours)" to { it["sleep_rem"].mean(removeNA=true) }
 )
 .sortedBy("Mean daily total sleep (hours)")
Now the summary lists the groups sorted by how much sleep they get, from least to most:

From this summary, you’ll see that herbivores sleep the least, carnivores and omnivores get a little more sleep, and insectivores get the most sleep, spending more time asleep than awake.
The summary might lead you to a set of hypotheses that you might want to test with more experiments. One of the more obvious ones is that herbivores are what carnivores and omnivores eat, which means that they have to stay alert and sleep less.
In data science, you’ll find that an often-used workflow is one that consists of doing the following to a data frame in this order:
- Filtering / Selecting
- Grouping
- Summarizing
- Sorting
Importing Data
While you can load data into a data frame using code, it’s quite unlikely that you’ll be doing it that way. In most cases, you’ll work with data saved in a commonly-used file format.
Data entry is a big and often overlooked part of data science, and spreadsheets remain the preferred data entry tool, even after all these years. They make it easy to enter tables of data, and they’ve been around long enough for them to become a tool that even casual computer users understand.
While spreadsheet applications save their files in a proprietary format, they can also export their data in a couple of standard plain-text formats that other applications can easily read: .csv and .tsv.
Reading .csv Data
One of the most common file formats for data is .csv, which is short for comma-separated value.
Each line in a .csv file represents a row of data, and within each line, each column value is delineated by commas. The first row contains column titles by default, while the remaining rows contain the data.
For example, here’s how the data frame you created earlier would be represented in .csv form:
language,developer,year_first_appeared,preferred
Kotlin,JetBrains,2011,true
Java,James Gosling,1995,false
Swift,Chris Lattner et al.,2014,true
Objective-C,Tom Love and Brad Cox,1984,false
Dart,Lars Bak and Kasper Lund,2011,true
Given a URL for a remote file, the readCSV() method of the DataFrame class reads .csv data and uses it to create a new data frame.
Enter and run the following in a new code cell:
val ramenRatings = DataFrame.readCSV("https://koenig-media.raywenderlich.com/uploads/2021/07/ramen-ratings.csv")
ramenRatings
You’ll see the following result:
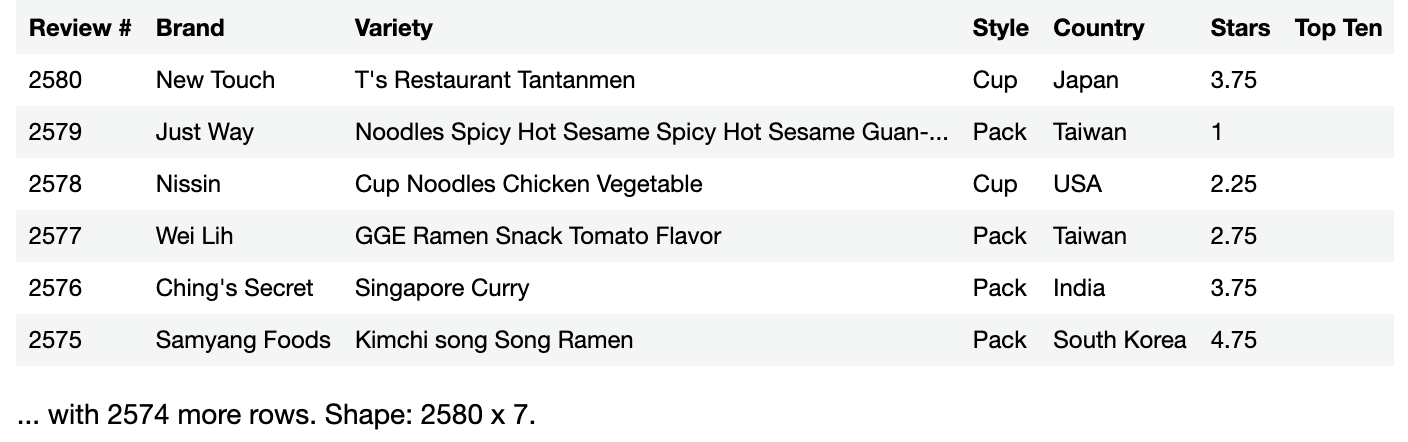
You could’ve just as easily downloaded the file and read it locally using readCSV(), as it’s versatile enough to work with both URLs and local filepaths.
Reading .tsv Data
The .csv format has one major limitation; since it uses commas as a data separator, the data can’t contain commas. This rules out certain kinds of data, especially text data containing full sentences.
This is where the .tsv format is useful. Rather than delimiting data with commas, the .tsv format uses tab characters, which are control characters that aren’t typically part of text created by humans.
The DataFrame class’ readTSV() method works like readCSV(), except that it initializes a data frame with the data from a .tsv file.
Run this code in a new code cell:
val restaurantReviews = DataFrame.readTSV("https://koenig-media.raywenderlich.com/uploads/2021/07/restaurant-reviews.tsv")
restaurantReviews
It should produce the following output:

You can see that any written text can appear.
Where to Go From Here?
You can download the Jupyter Notebook files containing all the code from the exercises above by clicking on the Download Materials button at the top or bottom of the tutorial.
You’ve completed your first steps in data science with Kotlin. The data frame basics covered here are the basis of many Jupyter Notebook projects, and they’re just the beginning.
There’s a lot more ground you can cover while exploring Kotlin-powered data science. Here are a few good starting points:
- Roman Belov’s presentation at KotlinConf 2019, Using Kotlin for Data Science. This is a grand tour of what you can do with Jupyter Notebook and the Kotlin Kernel, which includes drawing graphs as well as other libraries such as Kotlin NumPy and Apache Spark, and even using other “notebook” technologies like Apache Zeppelin.
- Kotlin Data Science Resources. A collection of showcase applications, Kotlin and Java libraries, resources for Kotlin and Python data science developers and other useful resources for your learning journey.
- Kotlin Jupyter Kernel for Data Analysis: Reviewing NFL Win Probability Models. If you’re looking an example of Kotlin being used in a data science project, this March 2021 presentation for the San Diego Kotlin User Group is a good one. This project attempts to predict NFL teams’ odds of winning based on historical data.
- Data Science on the JVM with Kotlin and Zeppelin. This 2021 presentation for the Chicago Kotlin User Group shows Kotlin being used on a different “notebook” platform: Apache Zeppelin. Many of the ideas shown in this video can be applied to Jupyter Notebook projects.
We hope you enjoyed this tutorial. If you have any questions or comments, please join the forum discussion below!