View Debugging in Xcode 6
In this tutorial, you will learn view debugging by using some of the awesome new tools provided with Xcode 6! By Scott Berrevoets.
Live Modifications
Now that you know the basics of view debugging in Xcode 6, it’s time to put that knowledge to work with a small exercise: For the collection view you’ve been exploring throughout the tutorial, make its vertical scroll indicator red by only using the debugger.
Here are two tips to get you started:
- Since view debugging is just like any other debugging session, you can use
exprand other commands in the console, but keep in mind changes won’t appear until you resume execution. For more information on these commands, take a look at this debugging apps in Xcode tutorial. - Because pointers in Objective-C are really just memory addresses, you’re simply messaging a memory address when you message an object. This works in the debugger as well, so a command like
po 0x123456abcdefwould print the description of the object at that memory address.
Give it some solid attempts before you break down and look at the solution below!
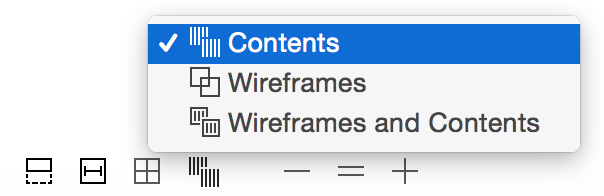
[spoiler title=”Solution”]First, make sure the view mode is set to “Contents”.
In the Debug navigator, expand the view tree of the collection view so you can see all its subviews.
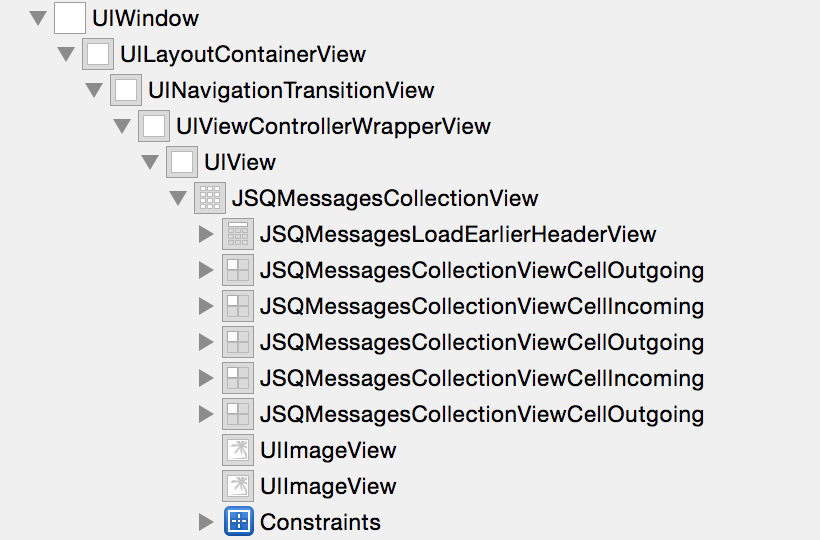
The last views of the collection views are two instances of UIImageView. These are the horizontal and vertical scroll indicators. Click on the second one, and you’ll see the vertical indicator highlighted in the canvas.

Copy the image view’s memory address from the Object inspector.
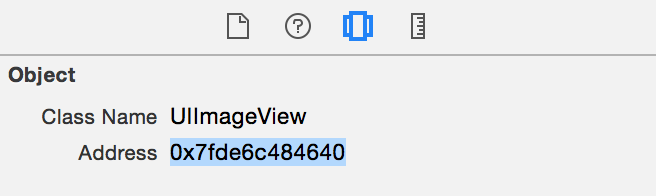
In this case, the memory address of the scroll indicator was 0x7fde6c484640. All that’s needed to color the scroll view indicator is to send a setBackgroundColor: message to the object at that address. The following will do just that:
expr (void)[0x7fde6c484640 setBackgroundColor:[UIColor redColor]]
Continue running the app, and you’ll notice the scroll indicator is red when you scroll the through the collection view.
[/spoiler]
Congratulations, you now know the basics of view debugging with Xcode 6!
Old School Debugging
Live view debugging made debugging views in Xcode 6 a lot easier, but that doesn’t mean that your favorite old school tricks are now useless. In fact, iOS 8 introduces a very welcome addition to the family of view debugging tricks: _printHierarchy.
Printing the View Controller Hierarchy
_printHierarchy is a private method on UIViewController that you can use to print the view controller hierarchy to the console. Build and Run, select Push via storyboard and then hit the pause button in the Debug bar.
Now type this in the console and press return:
po [[[[UIApplication sharedApplication] keyWindow] rootViewController] _printHierarchy]
You’ll get something very similar to this:
<UINavigationController 0x7fdf539216c0>, state: appeared, view: <UILayoutContainerView 0x7fdf51e33bc0>
   | <TableViewController 0x7fdf53921f10>, state: disappeared, view: <UITableView 0x7fdf5283fc00> not in the window
   | <DemoMessagesViewController 0x7fdf51d7d520>, state: appeared, view: <UIView 0x7fdf53c0b990>
This tells you that there is a UINavigationController whose first view controller is a TableViewController — the one where you chose how to push the controller. The second view controller is the DemoMessagesViewController, or the view controller you have been debugging.
It doesn’t seem too exciting in this particular example, but if you have several child view controllers within a navigation controller, and a tab bar controller in a popover in a modal view controller, (I’m not proud of some of my apps’ UI…) it can be immensely useful for figuring out exactly how the view controller hierarchy works.
Printing the View Hierarchy
If you’re not a very visual person and prefer a textual overview of a view hierarchy, you can always use the age-old, and also private, recursiveDescription on UIView. This prints a view hierarchy very similar to the view controller hierarchy as demonstrated above.
Open Views\JSQMessagesCollectionViewCellOutgoing.m and add a breakpoint in awakeFromNib.

Build and Run, then select Push via Storyboard. The debugger should break as a JSQMessagesCollectionViewCellOutgoing is loaded. Now type the following into the console:
po [self.contentView recursiveDescription]
This will print the hierarchy of the JSQMessagesCollectionViewCellOutgoing’s contentView, which will look something like this:
<UIView: 0x7fde6c475de0; frame = (0 0; 312 170); gestureRecognizers = <NSArray: 0x7fde6c484fe0>; layer = <CALayer: 0x7fde6c474750>>
   | <JSQMessagesLabel: 0x7fde6c475eb0; baseClass = UILabel; frame = (0 0; 312 20); text = 'Today 10:58 PM'; clipsToBounds = YES; opaque = NO; autoresize = RM+BM; userInteractionEnabled = NO; layer = <_UILabelLayer: 0x7fde6c476030>>
   | <JSQMessagesLabel: 0x7fde6c476400; baseClass = UILabel; frame = (0 20; 312 0); clipsToBounds = YES; opaque = NO; autoresize = RM+BM; userInteractionEnabled = NO; layer = <_UILabelLayer: 0x7fde6c476580>>
   | <UIView: 0x7fde6c476b50; frame = (70 20; 210 150); autoresize = RM+BM; layer = <CALayer: 0x7fde6c474dd0>>
   |    | <UIImageView: 0x7fde6c482880; frame = (0 0; 210 150); opaque = NO; userInteractionEnabled = NO; layer = <CALayer: 0x7fde6c476ae0>> - (null)
   | <UIView: 0x7fde6c482da0; frame = (282 140; 30 30); autoresize = RM+BM; layer = <CALayer: 0x7fde6c482d00>>
   |    | <UIImageView: 0x7fde6c482e70; frame = (0 0; 30 30); opaque = NO; autoresize = RM+BM; userInteractionEnabled = NO; layer = <CALayer: 0x7fde6c482f70>> - (null)
   | <JSQMessagesLabel: 0x7fde6c483390; baseClass = UILabel; frame = (0 170; 312 0); clipsToBounds = YES; opaque = NO; autoresize = RM+BM; userInteractionEnabled = NO; layer = <_UILabelLayer: 0x7fde6c483510>>
It’s rudimentary, but can be helpful when you want to debug a view hierarchy pre iOS 8.
Using debugQuickLookObject
Lastly, Xcode 5.1 introduced a feature called Debug Quick Look. This feature is most useful when you’re already debugging and aren’t wondering what an object looks like at a certain point in your code.
Your custom class can implement the method debugQuickLookObject and return anything that is visually presentable by Xcode. Then, when you’re debugging and you have an object you want to inspect, you can use quick look and Xcode will show you a visual representation of that object.
For example, NSURL’s implementation of debugQuickLookObject returns a UIWebView with that URL so you can actually see what’s behind the URL.
For more information on debugging using Quick Look, take a look at the documentation.