How To Create an Xcode Plugin: Part 1/3
Get started with exploring app internals as you learn about developing Xcode plugins and some LLDB tips in this first of a three-part tutorial series. By Derek Selander.
2 (1) · 1 Review
Finding and Inspecting the Build Status Alert
Now that you have your basic grounds for inspecting the NSNotification names triggered in Xcode, you need to turn your attention to figuring out the class associated with displaying the build alert.
Launch the Xcode plugin. In the child Xcode, open any project. Make sure you have bezel notifications enabled – in your Xcode settings, enable them for when builds succeed and fail. Again, make sure you’re changing the settings in your child Xcode instance!

Reset the notificationSet using the Reset Logger menu item you created, then run the child Xcode project.
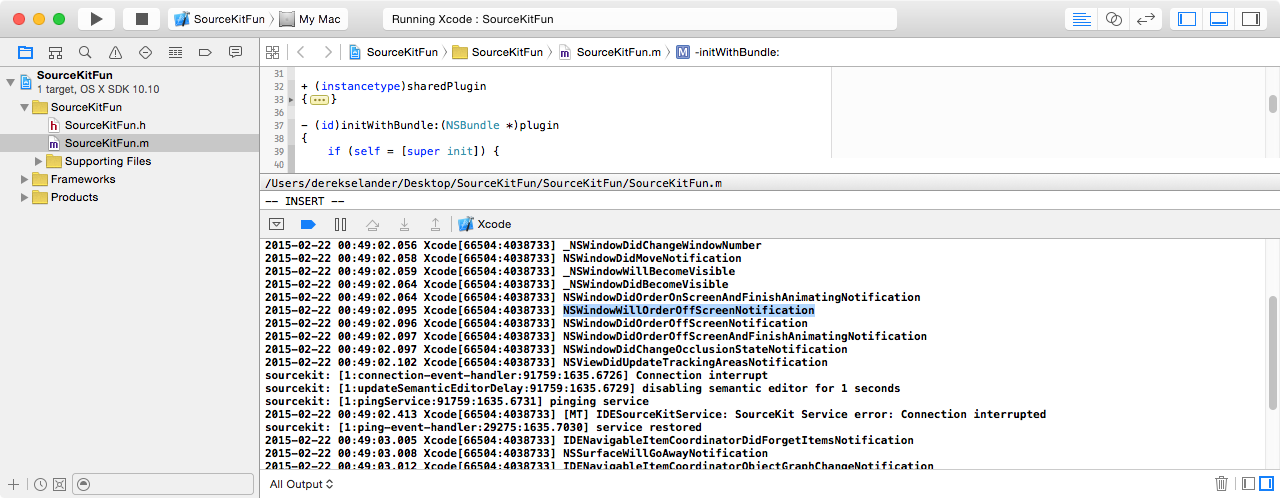
As the child Xcode’s build succeeds (or fails), keep an eye on the console messages. Skim through the console and see if there is anything of interest. Can you spot any notifications that look like they’re worth inspecting further? The solution is below in case you need a little help…
[spoiler title=”Hunting through notifications”]There are several items that could be worth inspecting further:
- NSWindowWillOrderOffScreenNotification, DVTBezelAlertPanel
- NSWindowDidOrderOffScreenNotification, DVTBezelAlertPanel
- NSWindowDidOrderOffScreenAndFinishAnimatingNotification, DVTBezelAlertPanel
[/spoiler]
You’ll pick one of these and explore it further to see what information you can dig out of it.
What about NSWindowWillOrderOffScreenNotification? Good choice! You’ll explore that one.
Still in Rayrolled.m, navigate to handleNotification: and add a breakpoint on the first line as shown by the image and corresponding steps below:

- Hover over the breakpoint, right-click the breakpoint and select Edit Breakpoint.
- In the condition section, paste
[notification.name isEqualToString:@"NSWindowWillOrderOffScreenNotification"] - In the Action Section, add
po notification.object - If the parent Xcode is not already running the child Xcode, launch the build, then launch a build in the child Xcode. The breakpoint will stop on the NSWindowWillOrderOffScreenNotification notification. Observe the
-[notification object]printed out. This isDVTBezelAlertPanel, the first of many private classes that you’ll be exploring.
You now have a potential lead. You have a class named DVTBezelAlertPanel, and more importantly, you have an instance of this class in memory. Unfortunately, you don’t have any headers for this file to determine if this is the instance responsible for displaying the Xcode alert. Hmm.
Actually…it is possible to obtain this information. Although you don’t have the headers for this class, you do have a debugger attached to the child Xcode, and memory can tell you as good of a story as any header file could.
While still paused in the debugger of the parent Xcode, enter the following in the parent Xcode’s LLDB Console:
(lldb) image lookup -rn DVTBezelAlertPanel
17 matches found in /Applications/Xcode.app/Contents/SharedFrameworks/DVTKit.framework/Versions/A/DVTKit:
...
This searches for the name DVTBezelAlertPanel within Xcode, as well as in any frameworks, libraries, and plugins loaded into the Xcode process, and spits out any matching contents. Look at the listed methods. Are there any methods within the DVTBezelAlertPanel image dump that could help correlate this class to this error message? I’ve provided some help below if you need it.
[spoiler title=”Interesting methods”]
The following methods in DVTBezelAlertPanel look interesting enough to explore further:
initWithIcon:message:parentWindow:durationinitWithIcon:message:controlView:duration:controlView
Perhaps peeking into the one of the two initialization methods listed above can be used to verify if you are on the right track with associating this class to the message of the visual alert.[/spoiler]
image lookup LLDB command will list methods that are implemented in memory. When applying this to a particular class, this does not take into account subclassing where other methods inherit from superclasses. That is, the lookup of this command will omit any methods only declared in superclasses provided the subclasses do not override the super method.Without moving or stepping in the LLDB console, inspect the contentView property in LLDB with the following command:
(lldb) po [notification.object controlView]
<nil>
The console spits out nil. Darn. Maybe this is because the controlView isn’t set at this time. Time to try a different tactic.
initWithIcon:message:parentWindow:duration and initWithIcon:message:controlView:duration: looked somewhat juicy. Since you know that the DVTBezelAlertPanel instance is already alive, one of these twp method calls must have already occurred. You’ll need to attach a breakpoint to both of these methods through the LLDB console and try and trigger this class’s initialization again.
While remaining paused in the LLDB console, type the following:
(lldb) rb 'DVTBezelAlertPanel\ initWithIcon:message:'
Breakpoint 1: 2 locations.
(lldb) br l
...
This sticks a regular expression breakpoint on both of DVTBezelAlertPanel‘s initializers referenced above. Since both methods have the same starting text in their initialization, the regex breakpoint will match both items. Make sure you have a \ before the space and surround the expression in single quotes so LLDB knows how to properly parse the regex.
Resume the child application, then re-build the child project. You’ll hit the initWithIcon:message:parentWindow:duration breakpoint in the debugger.
If you didn’t hit it, make sure you added the breakpoint to the parent Xcode, with the child Xcode running a project. Xcode will break on the assembly for this method since it doesn’t have the corresponding sourcefile for it.
Now that you’ve arrived in a method for which you don’t have the source code, you’ll need a way to print out the function parameters sent to the method. This is perhaps a good time as any to talk about…ASSEMBLY! :]

A Whirlwind Detour of Assembly
When working with private APIs, you’ll need to inspect registers instead of using the debug symbols typically available to you when working with source code. Knowing how registers behave on the x86-64 architecture can be tremendously helpful.
Although not a required read, this article is a good resource for catching up on x86 Mach-0 assembly. In Part 3 of this tutorial series, you’ll rip apart a method in the disassembler to see what it’s doing, but for now, you’ll take the easy road.
It’s worth noting the following registers and how they function:
-
$rdi: This register references the
selfparameter passed into a method; this is the first parameter passed in. - $rsi: Refers to the Selector passed. This is the second parameter.
- $rdx: The third parameter passed into a function, and the first parameter of an Objective-C method.
- $rcx: The fourth parameter passed into a function, and the second parameter of an Objective-C method.
- $r8: The fifth parameter passed into a function. $r9 is used for the 6th param followed by the stack frame used, if there are any more parameters required for the function call.
-
$rax: Return values are passed in this register. For example, when stepping out of –
[aClass description], $rax will contain anNSStringof theaClassinstance’s description.
doubles using the $xmm register family. Use the above quick reference as a guide.
Applying theory in practice to a real world example, take the method below.
@interface aClass : NSObject
- (NSString *)aMethodWithMessage:(NSString *)message;
@end

@implementation aClass

- (NSString *)aMethodWithMessage:(NSString *)message {
  return [NSString stringWithFormat:@"Hey the message is: %@", message];
}

@end
If you executed it like this:
aClass *aClassInstance = [[aClass alloc] init];
[aClassInstance aMethodWithMessage:@"Hello World"];
When compiled, the call to aMethodWithMessage: would be passed to objc_msgSend and would look roughly like this:
objc_msgSend(aClassInstance, @selector(aMethodWithMessage:), @"Hello World")
aMethodWithMessage: found in, aClass, would yield the following results in the set of registers:
Immediately upon calling aMethodWithMessage::
-
$rdi: Would contain an instance of
aClass. -
$rsi: Would contain the SEL
aMethodWithMessage:, which is basically achar *(trypo (SEL)$rsiin lldb). -
$rdx: Would contain the contents of
message, which will be the reference to the instance of:@"Hello World".
Immediately upon leaving the method:
-
$rax: Would contain the return value, which would be an instance of
NSString. For this particular case, it would be an instance of:@"Hey the message is: Hello World".