Introduction to Metrics in Server-Side Swift
In this Server-Side Swift tutorial you will learn how to use Vapor built-in metrics and how to create custom ones. The data is pulled and stored by Prometheus and visualized in beautiful graphs using Grafana. By Jari Koopman.
Bringing it All Together
Now, you’ll create a dashboard and start graphing these values. To start, stop your app in Xcode.
To set up a Prometheus and Grafana instance as well as run the Vapor app, you’ll use docker compose to run and orchestrate all this for you. Open Terminal and navigate to your projects directory using cd. In there, run docker-compose up --build. This will:
- Build and run your Vapor app.
- Set up a Prometheus server and start scraping your Vapor app.
- Set up a Grafana server and add Prometheus as a data source.
Trying Prometheus
You can find Prometheus at localhost:9090. Open the page, enter http_requests_total into the search field and hit Execute.
Prometheus query result as Table
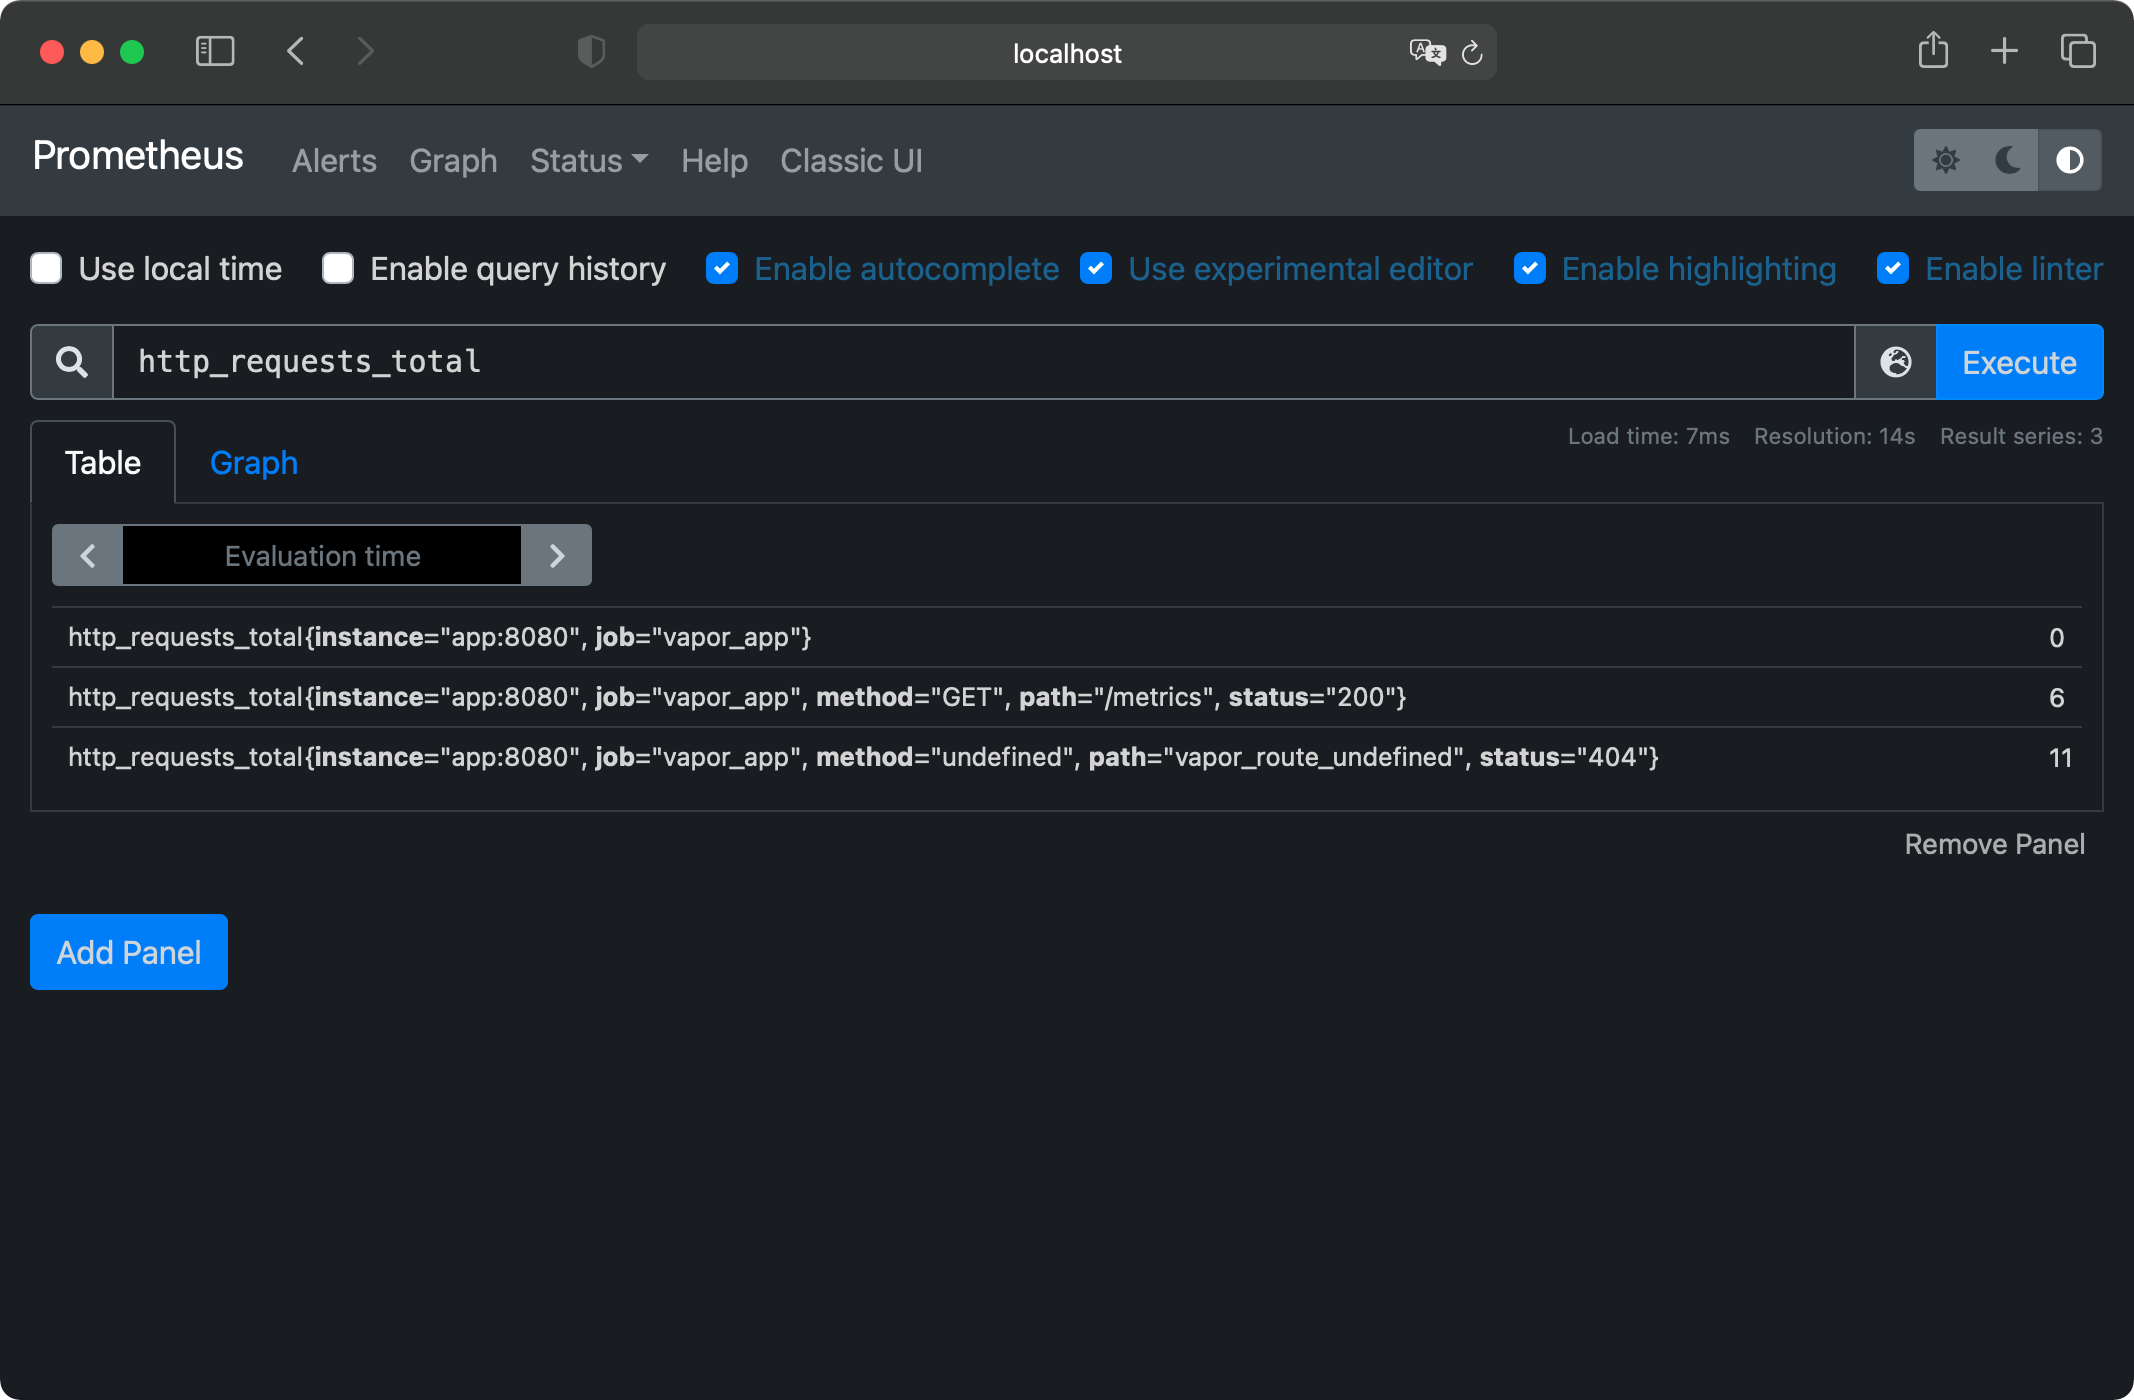
This will show you the same stat lines you got from the /metrics endpoint, with two extra labels added to each line. instance and job. Prometheus adds these when scraping. instance contains the host and port of the instance originating the metric, which you can use to distinguish if you’re running multiple instances of the same app. job contains a name for your application you can configure for every scraped target. The job will be the same for all instances of an app.
Switch the tab below the search bar to Graph and you’ll see an ever-rising line for the requests to /metrics because Prometheus polls it every five seconds. You’ll find the configuration used to set up Prometheus and add the scrape targets in prometheus.yml. There’s also a target in there monitoring Prometheus itself, providing metrics on the underlying system.
Focusing on the Changes
The current query is nice, but it only shows the current number of requests — which will only ever go up. A more useful graph would show the ups and downs of requests per minute. Luckily, Prometheus has a function for this! Called increase, this function measures the increase (or decrease) in a metric over a certain time. You’ll also add a sum function around all this to account for possible multiple instances of an application running. The new query will look like this:
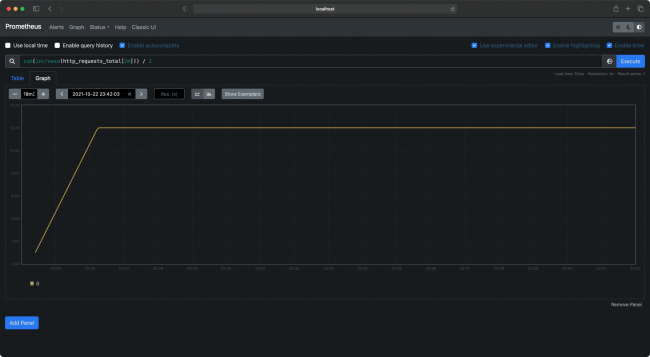
sum(increase(http_requests_total[2m])) / 2
Put the new query in the input field and hit execute, and you’ll see a flat graph at the number 12, as shown in the screenshot below. This magic number 12 comes from Prometheus scraping the metrics endpoint every 5 seconds, or 12 times a minute.
Prometheus graph example
If you start refreshing your API randomly and refresh the graph by re-executing the query, you’ll start to see ups and downs in the graph. Awesome!
Creating a Dashboard
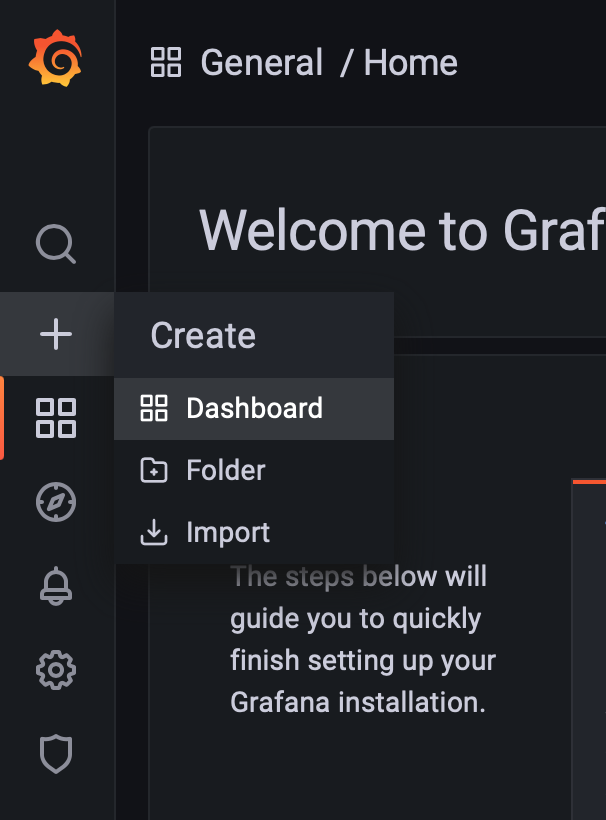
Next, navigate your browser to localhost:3000, this is where Grafana lives. You’ll be prompted with a login page. The default credentials are admin as both username and password. Once logged in, you’ll see Grafana’s homepage. On the left side of the screen, hover over the + icon and select Dashboard from the dropdown.
Grafana create Dashboard button
This will create a new dashboard with the first panel already added. Inside the panel, select Add an empty panel. This opens up the panel editor, which offers a few sections:
Grafana panel settings
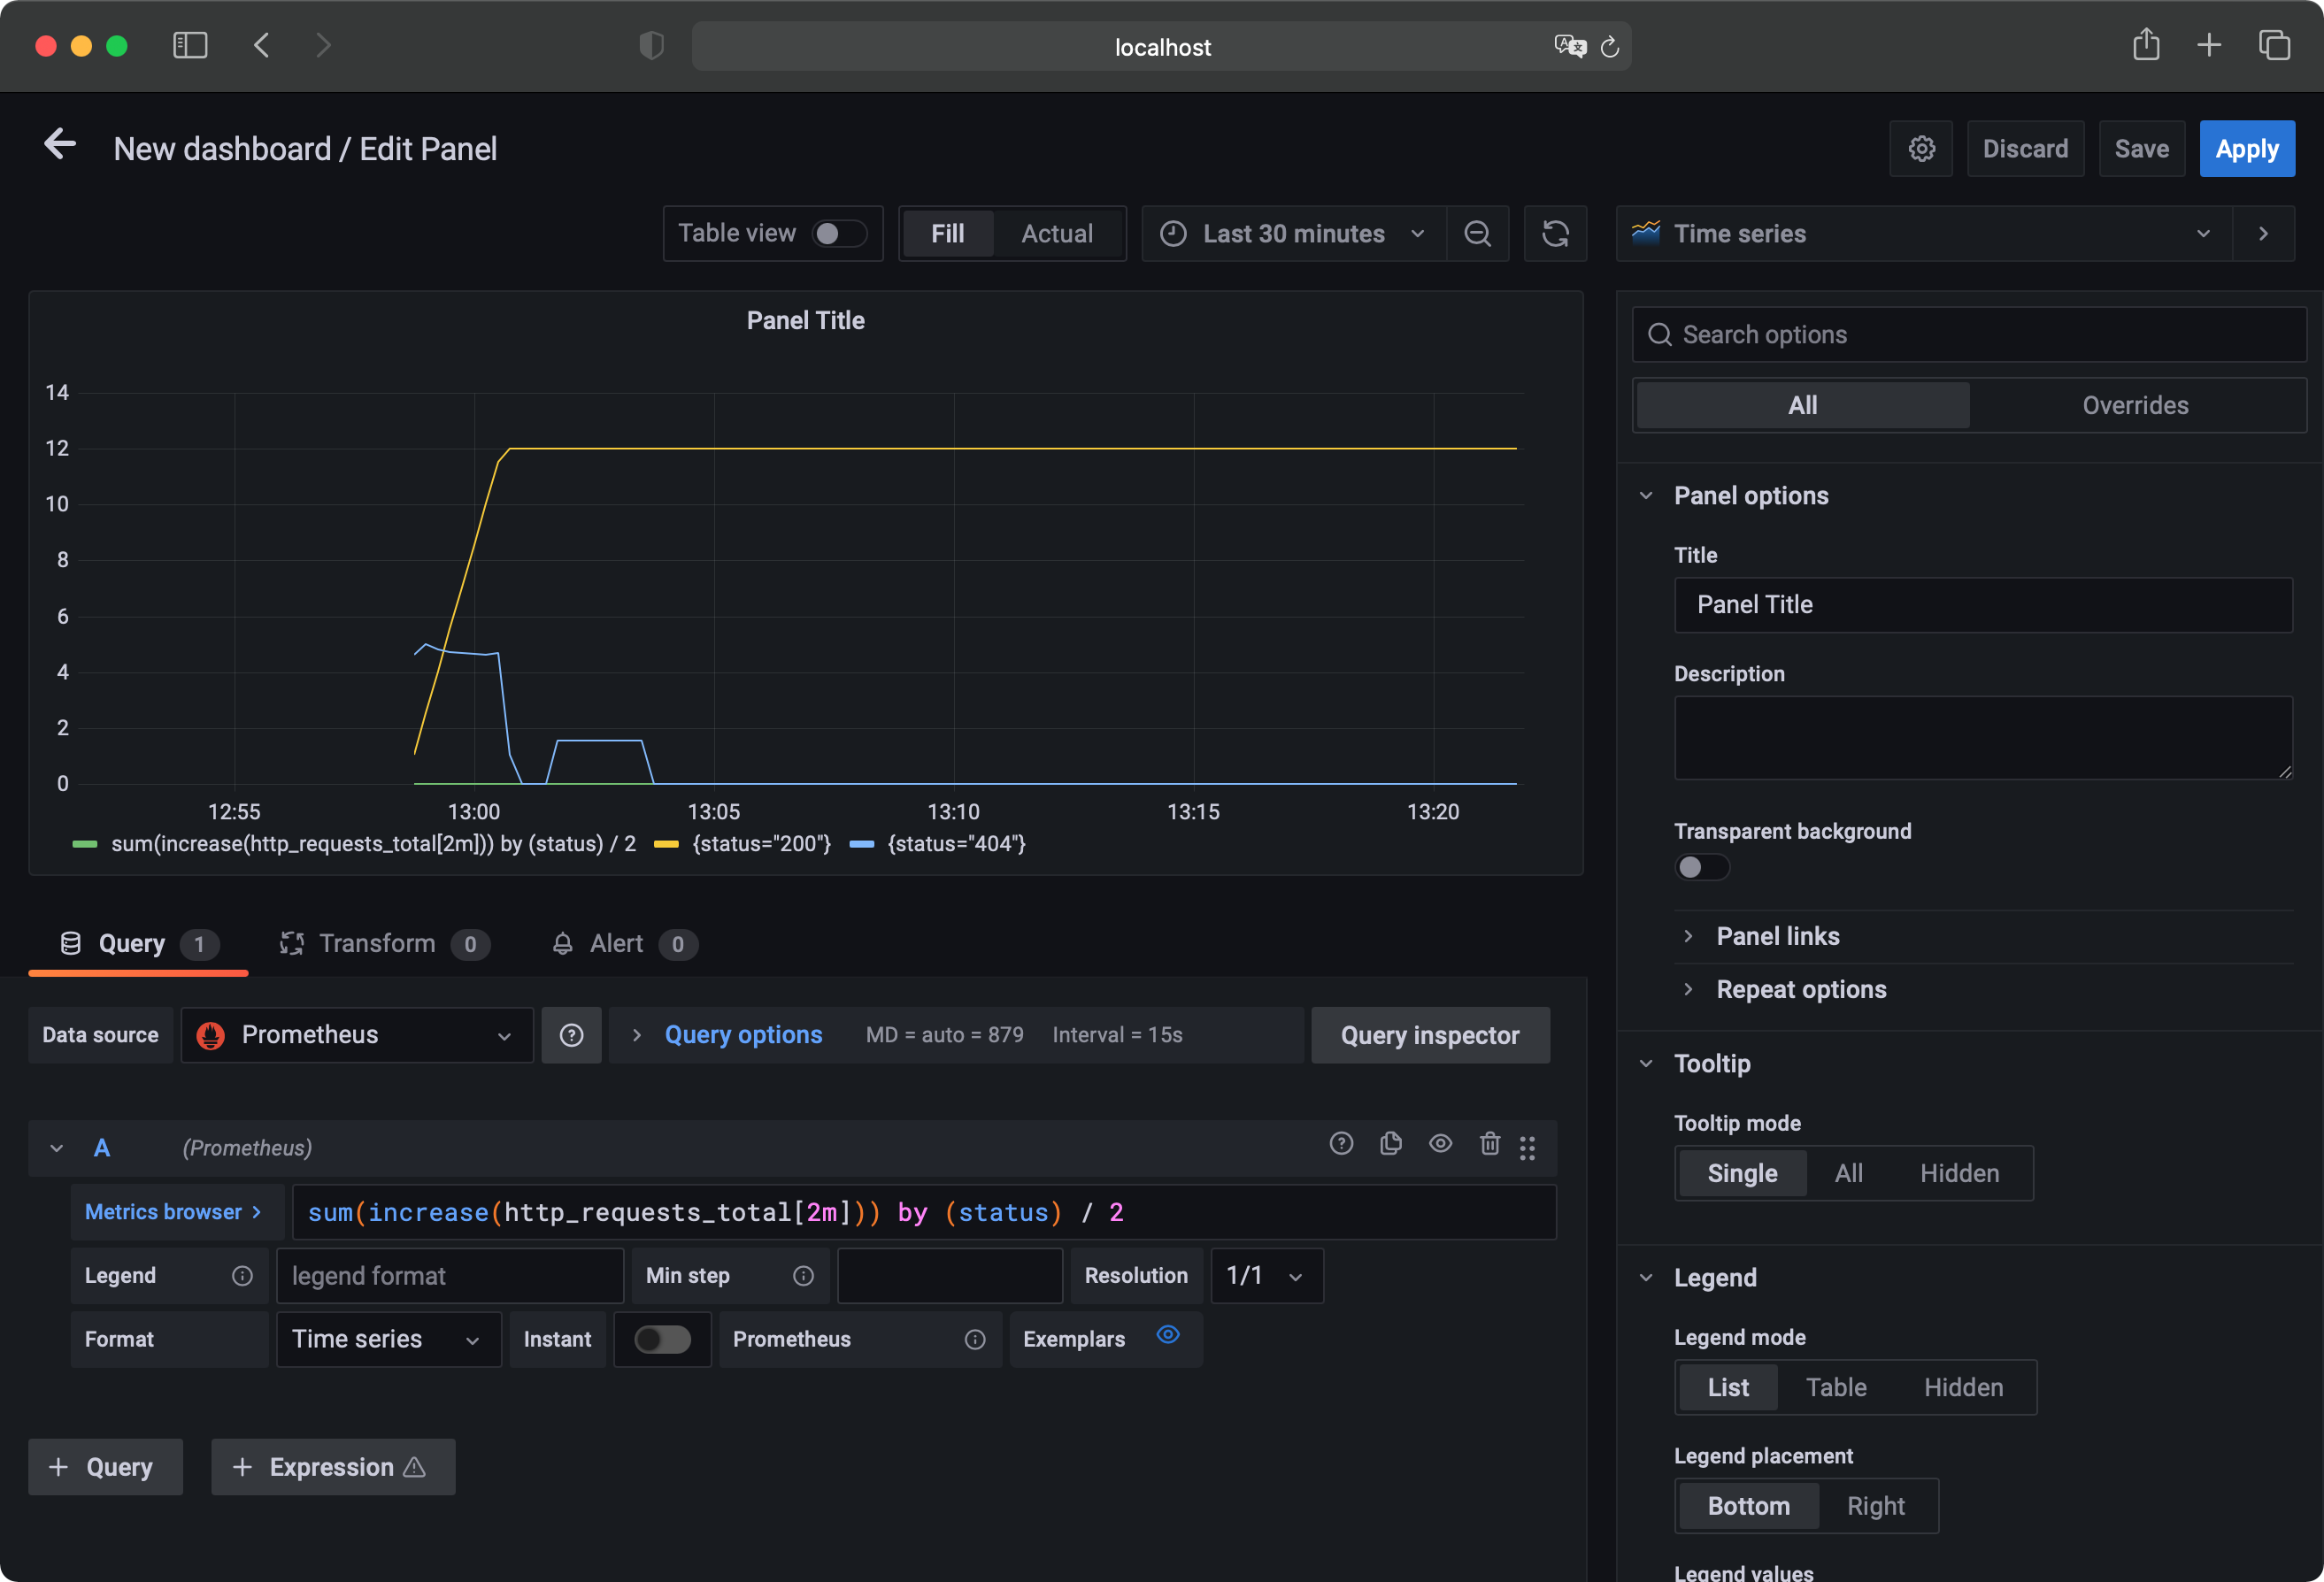
- The biggest area is the panel preview. When creating a new panel, it will say “No data in response”.
- Below the panel preview is the query editor. This is where you can input one or more queries to show in the graph.
- The right bar contains options to customize the look and feel of your panel, relating to colors, legend, axes and graph styles.
Enter the same query used in the Prometheus dashboard into the query editor. You’ll see the same graph from the Prometheus dashboard in the panel preview.
Distinguishing by Status
The current query returns the total HTTP Requests to your Vapor app. In most cases, it’s more useful to see requests grouped by status code, path or method. To do this, edit the query to the following:
sum(increase(http_requests_total[2m])) by (status) / 2
Adding the by clause to the query returns a separate dataset for every value of status Prometheus has observed.
Below the panel preview, you’ll now see a little legend with two colors and two labels. One of them is your query, and the other is {status="200"}. The first line consists of metrics without labels, which are not of interest in this case. To exclude them, add a filter to your PromQL query. Edit your query to the following:
sum(increase(http_requests_total{path!=""}[2m])) by (status) / 2
Anything inside the curly brackets is added as a filter to the query, in this case allowing metrics only where the path isn’t an empty string. It’s also a good practice to add a filter based on the job label added by Prometheus, so you see metrics of only the application you’re interested in. Your final query will look like this:
sum(increase(http_requests_total{job="vapor_app",path!=""}[2m])) by (status) / 2
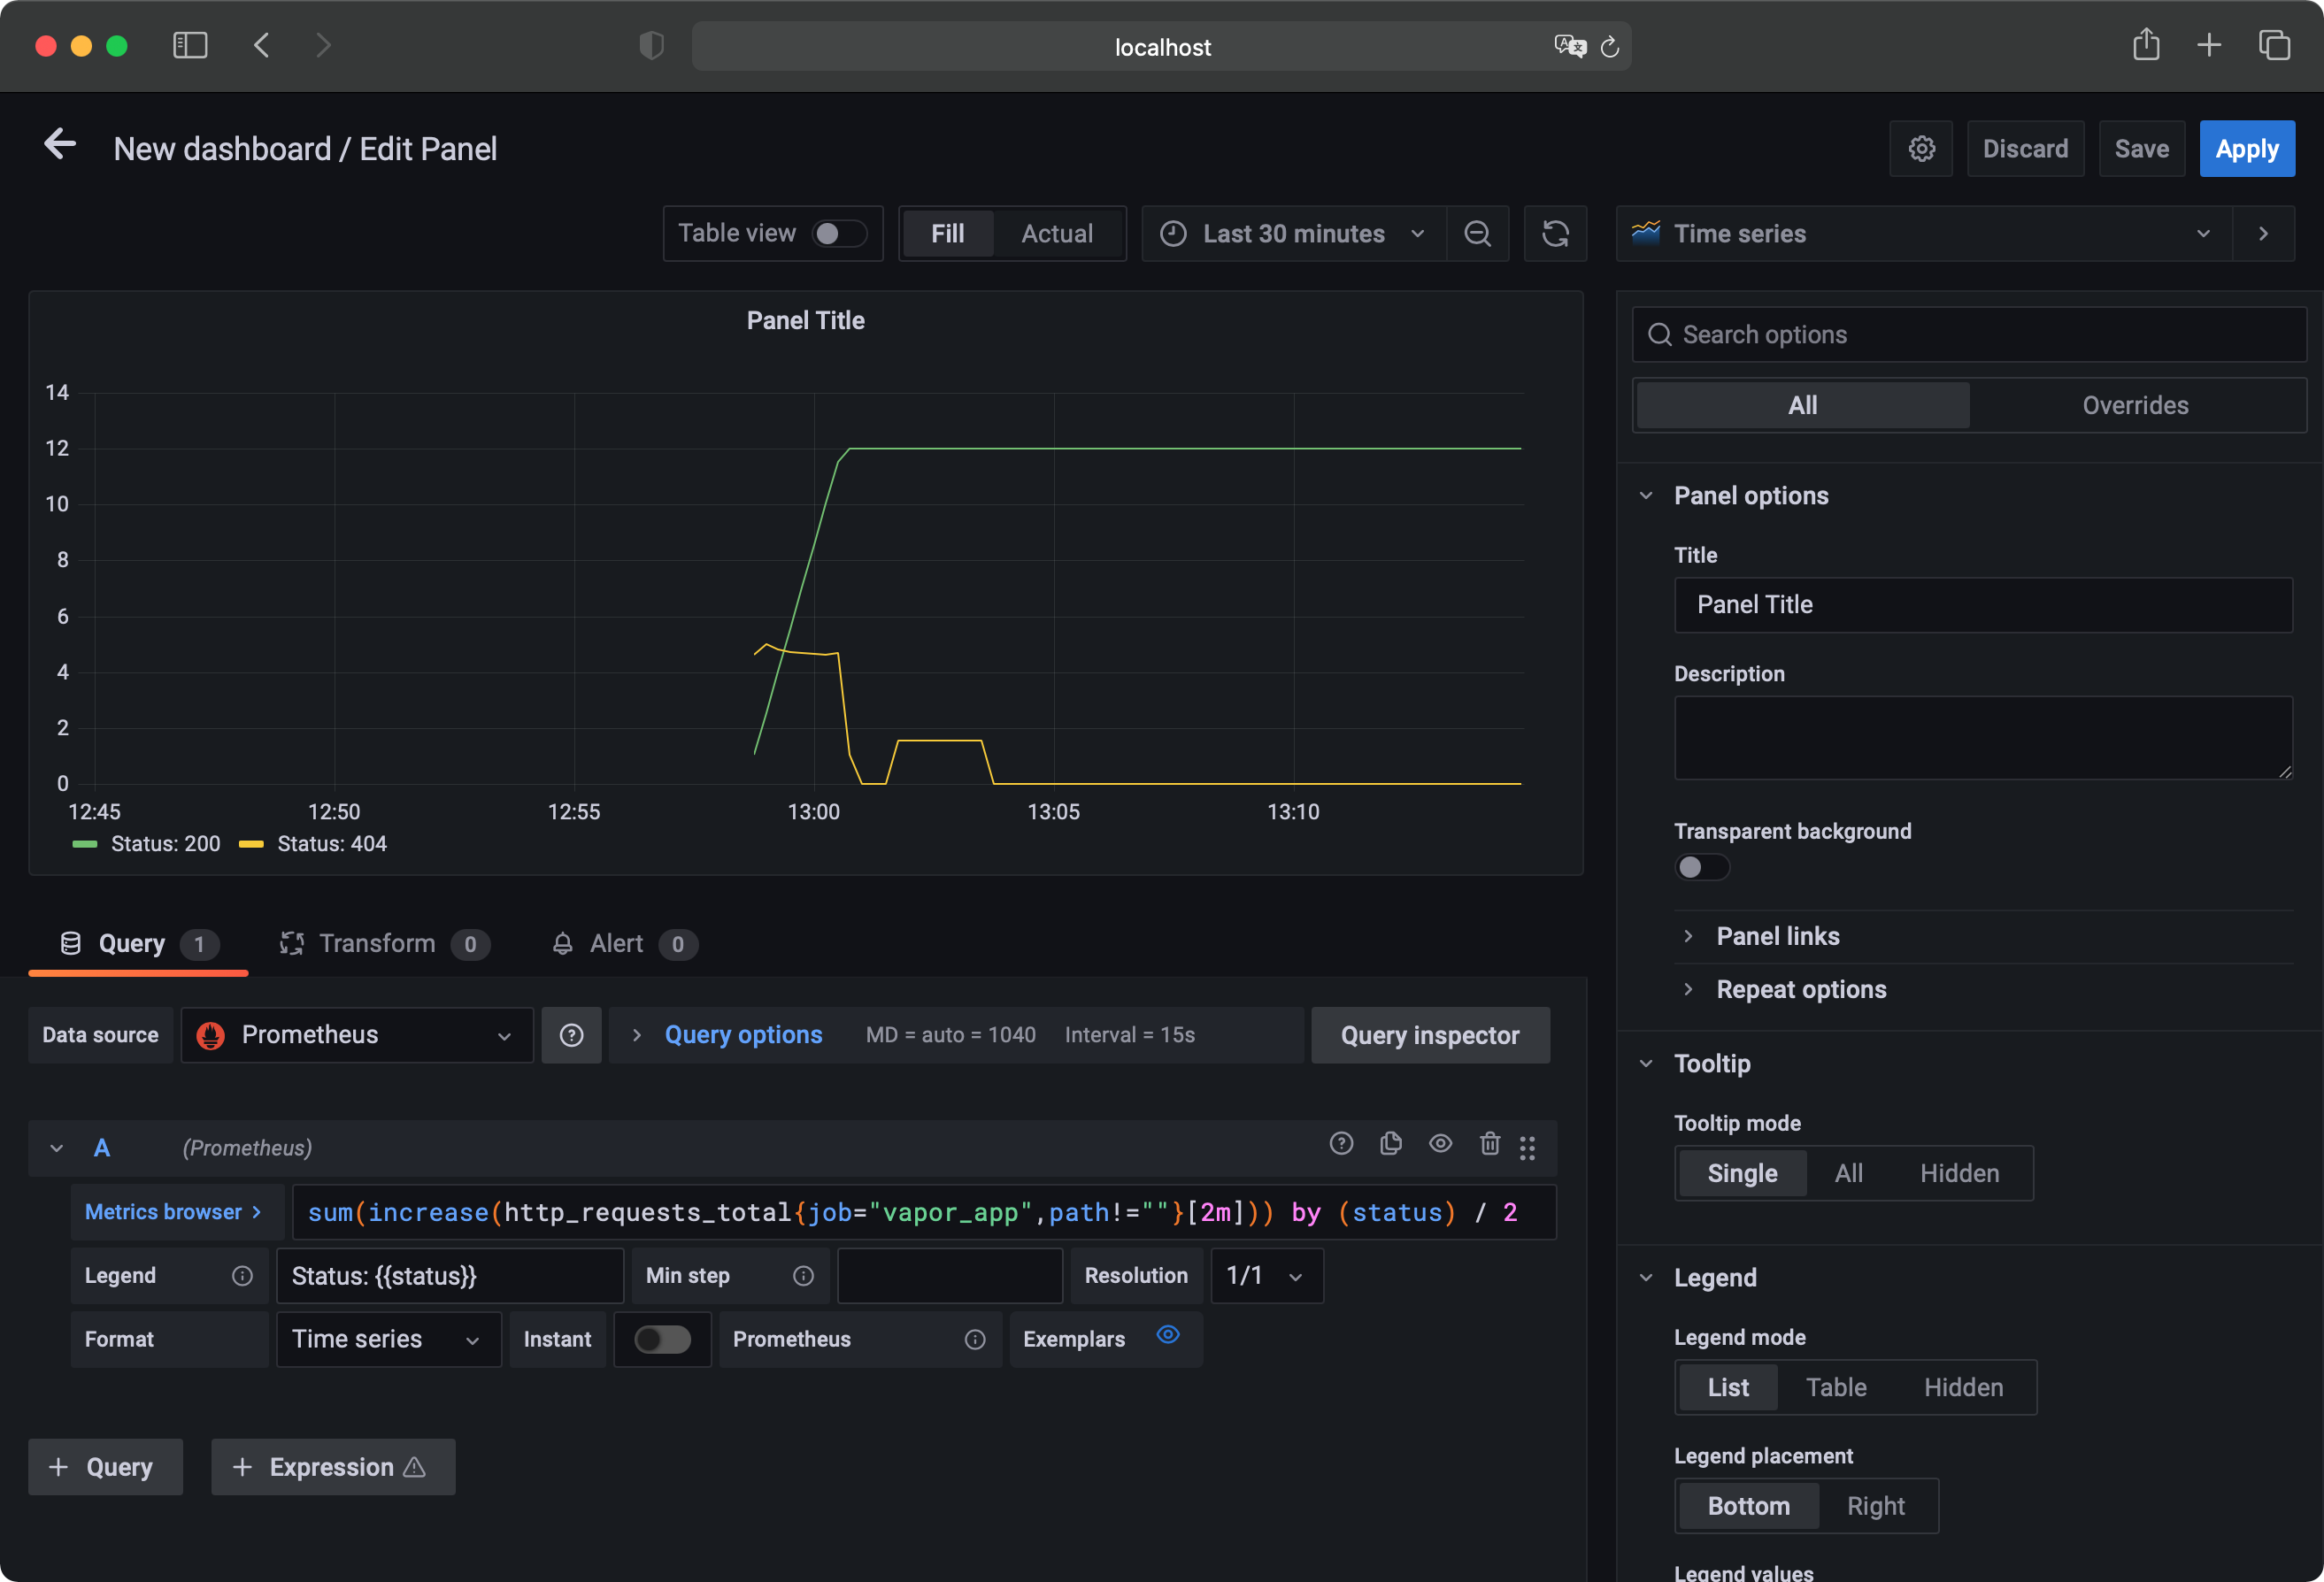
Improving the Legend
Looking at the legend below the panel preview, the graph is still named {status="200"}. Using the legend format field below the query field in the query editor, you can input a name format used by the legend. For this query, input: Status: {{status}}. Use label names surrounded by double curly brackets to template your query names. The label in the legend now shows Status: 200.
To make a new line appear, send a couple GET requests to your API homepage at localhost:8080. Wait a couple seconds and refresh the graph using the refresh icon at the top right of the panel preview area. A new line should appear, labeled Status: 404.
To get a closer look at your metrics, edit the time shown in the graph. This defaults to six hours. Using the dropdown to the left of the refresh button, select relative or absolute time ranges. For now, select Last 15 minutes as the relative time option.
Grafana panel settings
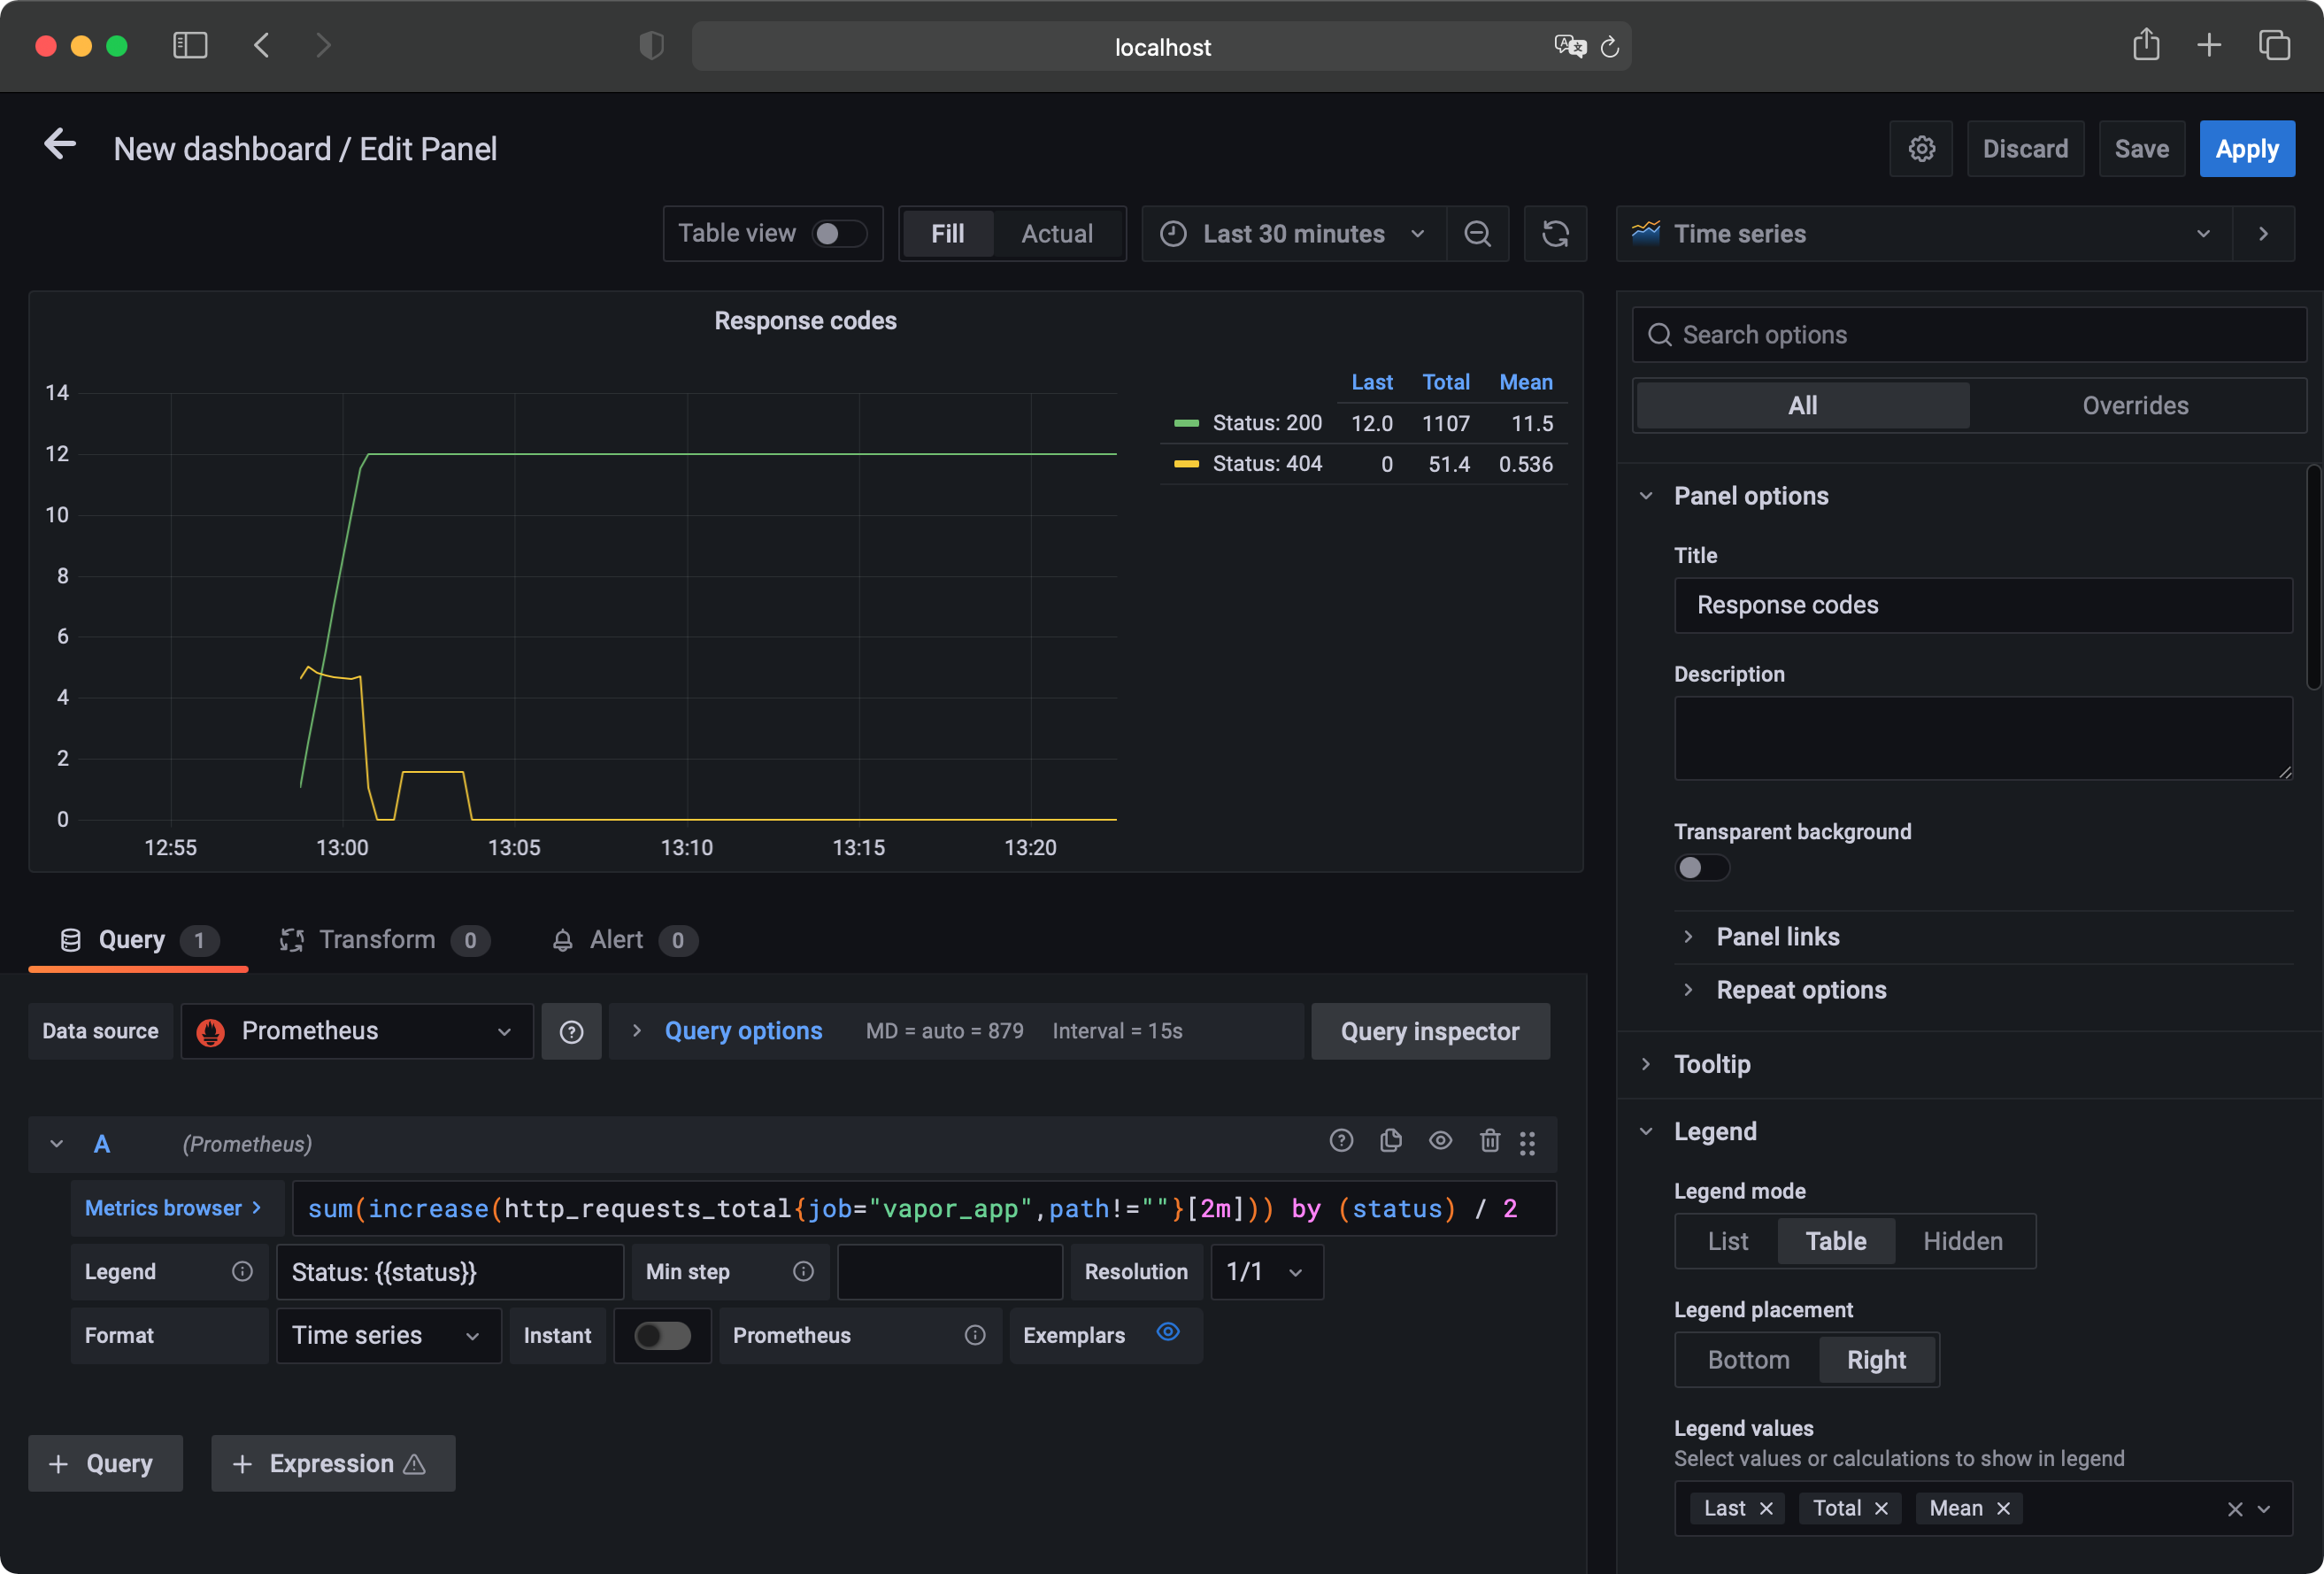
Finishing
You just set up your first dashboard panel. As a finishing touch, you’ll add a bigger legend with some aggregated values and a panel title. To do this, find the Legend section in the right sidebar and select Table as legend mode. Also select Right for the placement option. In the Legend Values field, input Last, Total and Mean. Next, scroll to the top of the sidebar and enter Response codes/min in the Title field.
Grafana final panel settings
At the top-right corner of the window, click the Save button and enter a BirdWatch - My Vapor Metrics as your dashboard name. Click save again, and you’ll see your dashboard in all its glory! You can resize panels or add new ones using the add panel button at the top right of the screen. Take your time adding panels, playing around with all the options and building out a dashboard containing useful metrics like:
- Response times per endpoint.
- Requests per endpoint.
- Request statuses per endpoint.
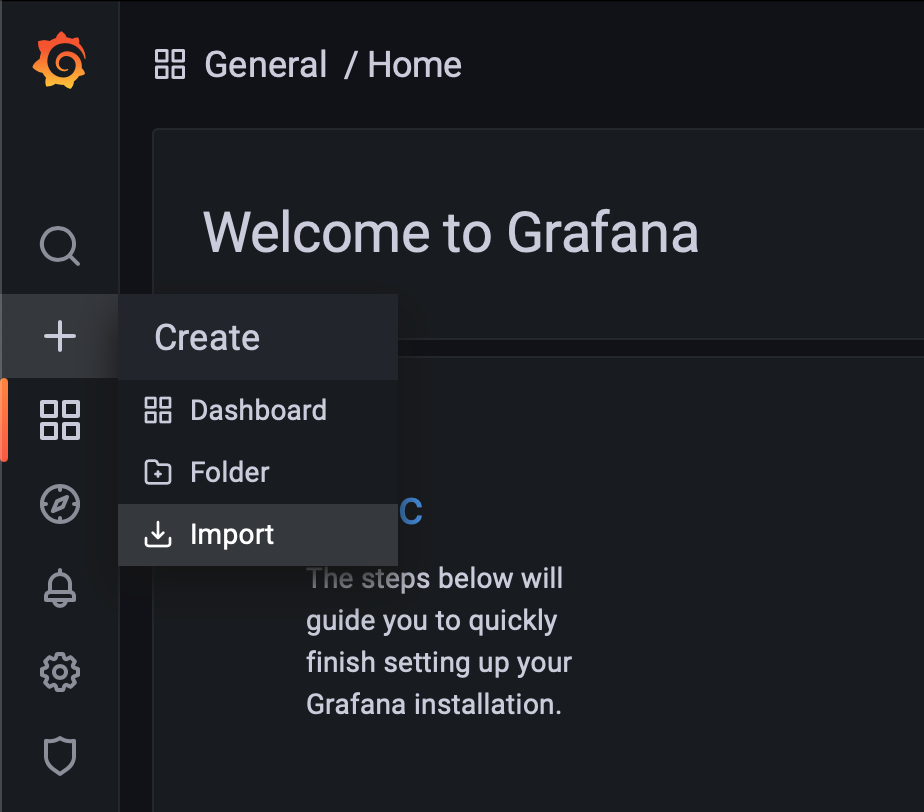
Using the Predefined Dashboard
You also can create metrics! You’ll find a JSON file in the starter project called dashboard_starter.json. Use this as a template and import it into Grafana. To do this, hover over the + icon in the left sidebar and select Import. Here, you can upload the JSON file or paste its contents. When you’ve selected your file, click the Import button and voila!
Import dashboard in Grafana
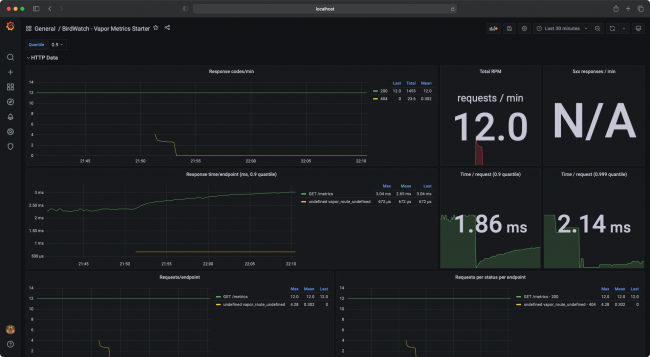
It’s a new dashboard you can edit and reuse for all your future Vapor apps.
The Grafana dashboard from the provided JSON file.
You’ve covered basic, out-of-the-box Vapor metrics. Next, you’ll learn how to add custom metrics in your application and use them in your dashboards.