Sponsored Tutorial: Improving Your App’s Performance with Pulse.io
Learn how you can use Pulse.io to notify you of low frame rates, app stalls and more. Let us walk you through all the features in this Pulse.io tutorial. By Adam Eberbach.
Instrumenting Custom Classes and Methods
By default, Pulse.io automatically instruments the key parts of your app to check for things such as excessive wait time and network access.
If you have custom classes that perform a lot of work such as the route calculator object in your app, you can add instrumentation to them using instrumentClass:. As well, you can add a specific selector using instrumentClass:selector: rather than instrumenting every message from the class.
Add the following import to the top of main.m:
#import "PathRouter.h"
Next, add the following line immediately after the PulseSDK monitor line you added in the previous section:
[PulseSDK instrumentClass:[PathRouter class] selector:@selector(orderPathPoints:)];
Pulse.io will now trace every time a PathRouter instance receives the orderPathPoints: message. Adding instrumentation to a method adds around 200-1000ns of execution time to that method call. This isn’t a real big hit — unless you call that method in a tight loop. Plan your instrumentation accordingly.
Take a look at PathRouter.m; you’ll see that orderPathPoints: performs the heavy lifting of finding a reasonable path between points. This is an algorithmically difficult problem, and probably a good spot to add some instrumentation.
Customizing Action Names
The actions reported by Pulse.io are grouped by the user action that triggered them. For example, if the user pans a map, you’ll see methods that result from that pan operation descending from a UIPanGestureRecognizer. It would be a great idea to attach more meaningful names to some operations to make them easier to find and understand.
Open MapSightsViewController.m and add the following Pulse.io header import to the top of the file:
#import <PulseSDK/PulseSDK.h>
Next add the following line to the beginning of mapView:viewForAnnotation::
[PulseSDK nameUserAction:@"Providing Annotation View"];
Now when you look at the results on the Pulse.io dashboard, you’ll see this method is reported using the friendly name instead.
Analyzing Data
Build and run the app again to generate some more data to analyze. After a little time has passed, say a minute or so, check the Pulse.io dashboard statistics for your application to see what they show. You should see something similar to that below. If you don’t, wait a little while longer and try again. It can take up to an hour for data to trickle in. That’s not a problem in practice though, because you will want to collect a lot of data and then work on it when it’s all in.

Things look a little sparse with just one user generating data with one app, but you can imagine the distributions would smooth out with many users contributing more data. The overview presented above serves as a signpost to the areas you should examine in more detail.
At the top of the browser window there is a row of buttons which you can use to drill down into each metric, as shown below:

The first item to drill down into is the total spinner time of your app.
Evaluating Spinner Times
Click on the UI Performance\Spinner Time button on the web site for a more detailed view of your data. Pulse.io hooks into UIActivityIndicator to determine how much time your users spend looking at that spinning animation while they wait, as shown below:

Er, that’s pretty ugly! The app displays a spinner for an average of nearly two seconds each time it appears. There’s no way a user would find that acceptable. Click on the Providing Annotation View user action to see more detail as illustrated below:

Those large image requests are taking a lot of time. Note that down as one problem to fix once you’re done reviewing the data on other problem areas.
Note: If you display a custom spinner or other view while the user is waiting, you can use startSpinner:trackVisibility: and stopSpinner: to track your spinner events as detailed in the Tracking a Custom Spinner Pulse.io API documentation.
Evaluating Frame Rate
Next, click on the UI Performance\Frame Rate button to show the detail view like so:
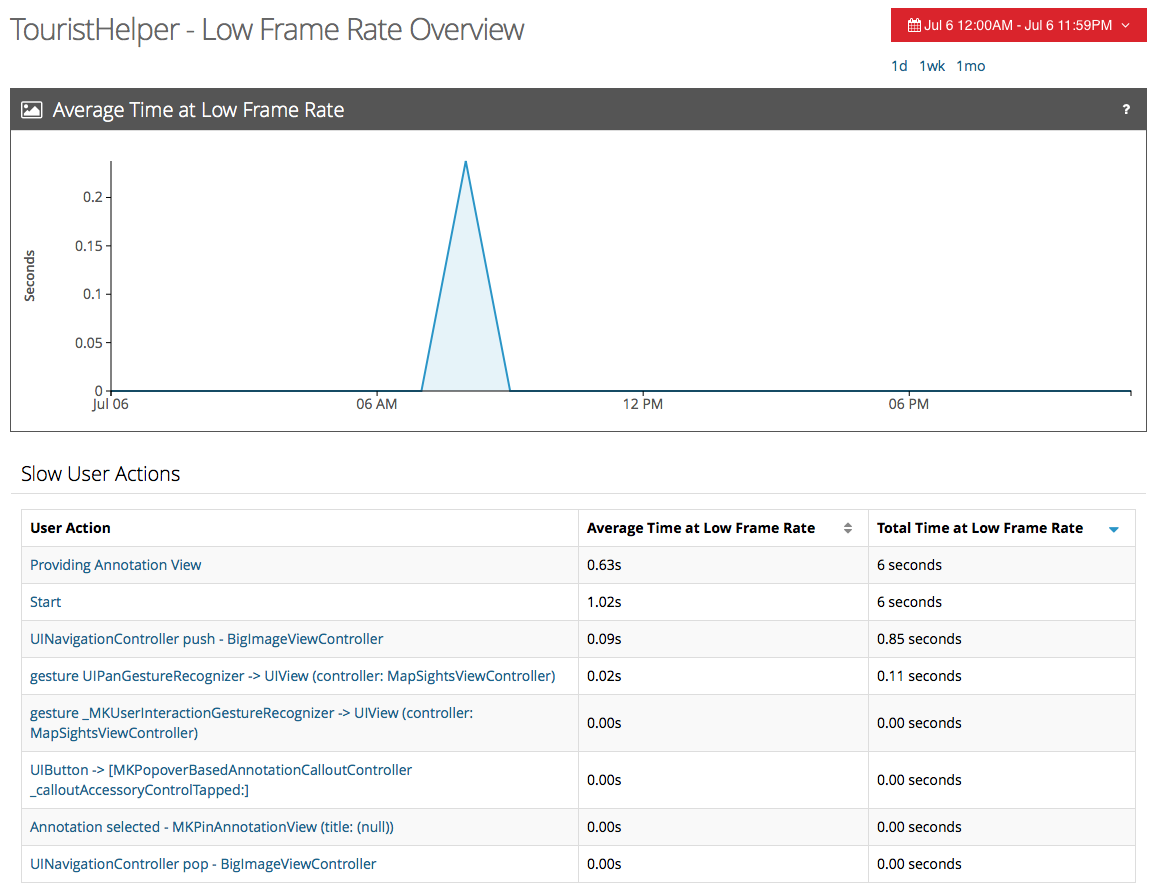
This view shows that there was a total of six seconds of low frame rate when displaying annotations descending from the method you annotated with the name Providing Annotation View. That’s beyond unacceptable for your app!
Note this issue on your fix list as well; you’ll have to revisit how you’re handling annotations in order to fix this.
Network Details
Next, click on the Network\Speed button to drill down into the data. Then select Network\Errors. Generally speed and error count are the two things to investigate when it comes to networking.
The image below shows an example of Pulse.io catching some network errors:

The normal HTTP status response is 200, meaning OK. However a couple of times the app received a 403 code meaning Forbidden. Recently Flickr mandated use of https and started denying plain http requests, which you made earlier in your app before you modified it to use https exclusively.
It’s good to know that Pulse.io will report any client-side, server-side, or network access issues your app will encounter.
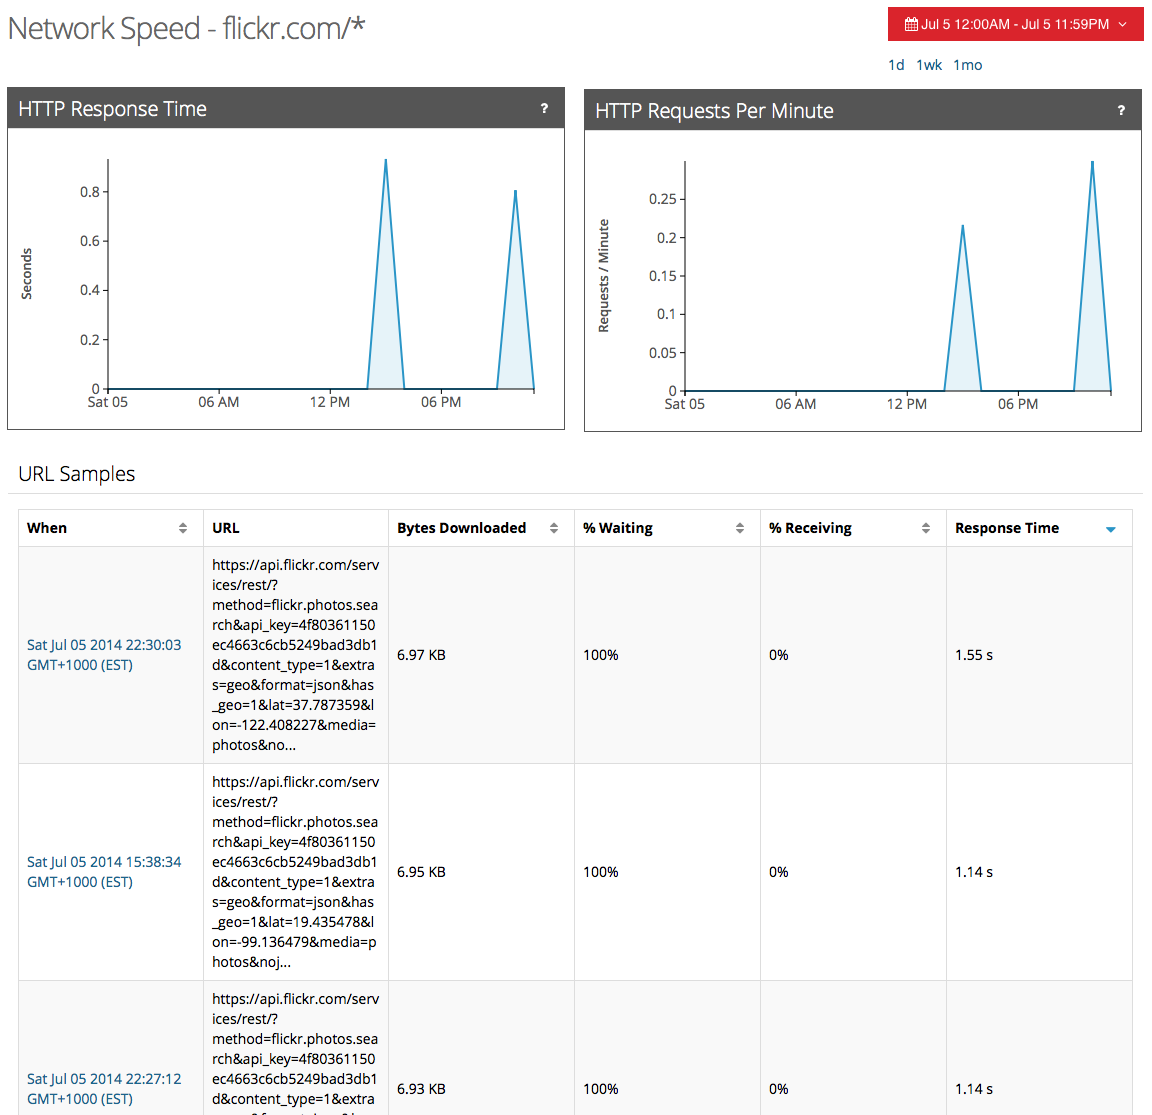
Here’s a sample view of Pulse.io’s view of your networking speed:

Pulse.io reports speed as time per request and breaks the results down into time waiting and time receiving. This is useful data; if you find your user base growing and your server being overwhelmed by traffic you’ll see the wait time slowly creep up as time goes on.
Consider the sheer number of requests shown here from only one user with one app. It looks like there are an excessive number of requests for the limited amount of time you’ve used your app. Making excessive requests eats up bandwidth and keeping the network active wastes battery. Note this as another item to fix.
Below the chart you can see a list titled Aggregate URL Response Times. Select flickr.com/* in this list to see some of the RESTful queries your app made to Flickr.
Take a closer look at the results: there’s some sensitive information there, including your app’s Flickr API key and secret! That should be stripped out of your request before the wrong people see it.