Core Graphics on macOS Tutorial
Core Graphics is Apple’s 2D drawing engine for OS X. Discover how to build a great disc info app for OS X using Core Graphics to draw charts in this Core Graphics on OS X tutorial. By Ernesto García.
4.6 (5) · 1 Review
Graphics Contexts
When you use Core Graphics, you don’t draw directly into the view. You use a Graphics Context, and that’s where the system renders the drawing and displays it in the view.

Core Graphics uses a “painter’s model”, so when you draw into a context, think of it as if you were swooshing paint across a canvas. You lay down a path and fill it, and then lay down another path on top and fill it. You can’t change the pixels that have been laid down, but you can paint over them.
This concept is very important, because ordering affects the final result.

Drawing Shapes with Paths
To draw a shape in Core Graphics, you need to define a path, represented in Core Graphics by the type CGPathRef and its mutable representation CGMutablePathRef. A path is simply a vectorial representation of a shape. It does not draw itself.
When your path is ready, you add it to the context, which uses the path information and drawing attributes to render the desired graphic.
Make a Path…For The Bar Chart
A rounded rectangle is the basic shape of the bar chart, so start there.
Open GraphView.swift and add the following extension at the end of the file, outside of the class definition:
// MARK: - Drawing extension

extension GraphView {
  func drawRoundedRect(rect: CGRect, inContext context: CGContext?,
                       radius: CGFloat, borderColor: CGColor, fillColor: CGColor) {
    // 1
    let path = CGMutablePath()

    // 2
    path.move( to: CGPoint(x:  rect.midX, y:rect.minY ))
    path.addArc( tangent1End: CGPoint(x: rect.maxX, y: rect.minY ),
                 tangent2End: CGPoint(x: rect.maxX, y: rect.maxY), radius: radius)
    path.addArc( tangent1End: CGPoint(x: rect.maxX, y: rect.maxY ),
                 tangent2End: CGPoint(x: rect.minX, y: rect.maxY), radius: radius)
    path.addArc( tangent1End: CGPoint(x: rect.minX, y: rect.maxY ),
                 tangent2End: CGPoint(x: rect.minX, y: rect.minY), radius: radius)
    path.addArc( tangent1End: CGPoint(x: rect.minX, y: rect.minY ),
                 tangent2End: CGPoint(x: rect.maxX, y: rect.minY), radius: radius)
    path.closeSubpath()

    // 3
    context?.setLineWidth(1.0)
    context?.setFillColor(fillColor)
    context?.setStrokeColor(borderColor)

    // 4
    context?.addPath(path)
    context?.drawPath(using: .fillStroke)
  }
}
TL/DR: That is how you draw a rectangle. Here’s a more comprehensive explanation:
- Create a mutable path.
- Form the rounded rectangle path, following these steps:
- Move to the center point at the bottom of the rectangle.
- Add the lower line segment at the bottom-right corner using
addArc(tangent1End:tangent2End:radius). This method draws the horizontal line and the rounded corner. - Add the right line segment and the top-right corner.
- Add the top line segment and the top-left corner.
- Add the right line segment and the bottom-left corner.
- Close the path, which adds a line from the last point to the starter point.
You’ll never look at a rectangle the same way! Here’s the humble result of all that code:

Note: For more information about how path drawing works, check out Paths & Arcs in Apple’s Quartz 2D Programming Guide.
Calculate the Bar Chart’s Position
Drawing with Core Graphics is all about calculating the positions of the visual elements in your view. It’s important to plan where to locate the different elements and think through they should behave when the size of the view changes.
Here’s the layout for your custom view:

Open GraphView.swift and add this extension:
// MARK: - Calculations extension

extension GraphView {
  // 1
  func pieChartRectangle() -> CGRect {
    let width = bounds.size.width * Constants.pieChartWidthPercentage - 2 * Constants.marginSize
    let height = bounds.size.height - 2 * Constants.marginSize
    let diameter = max(min(width, height), Constants.pieChartMinRadius)
    let rect = CGRect(x: Constants.marginSize,
                      y: bounds.midY - diameter / 2.0,
                      width: diameter, height: diameter)
    return rect
  }

  // 2
  func barChartRectangle() -> CGRect {
    let pieChartRect = pieChartRectangle()
    let width = bounds.size.width - pieChartRect.maxX - 2 * Constants.marginSize
    let rect = CGRect(x: pieChartRect.maxX + Constants.marginSize,
                      y: pieChartRect.midY + Constants.marginSize,
                      width: width, height: barHeight)
    return rect
  }

  // 3
  func barChartLegendRectangle() -> CGRect {
    let barchartRect = barChartRectangle()
    let rect = barchartRect.offsetBy(dx: 0.0, dy: -(barchartRect.size.height + Constants.marginSize))
    return rect
  }
}
The above code does all of these required calculations:
- Start by calculating the position of the pie chart — it’s in the center vertically and occupies one third of the view’s width.
- Here you calculate the position of the bar chart. It takes two thirds of the width and it’s located above the vertical center of the view.
- Then you calculate the position of the graphics legend, based on the minimum Y position of the pie chart and the margins.
Time to draw it in your view. Add this method inside the GraphView drawing extension:
func drawBarGraphInContext(context: CGContext?) {
  let barChartRect = barChartRectangle()
  drawRoundedRect(rect: barChartRect, inContext: context,
                  radius: Constants.barChartCornerRadius,
                  borderColor: barChartAvailableLineColor.cgColor,
                  fillColor: barChartAvailableFillColor.cgColor)
}
You’ve added a helper method that will draw the bar chart. It draws a rounded rectangle as a background, using the fill and stroke colors for the available space. You can find those colors in the NSColor+DiskInfo extension.
Replace all the code inside draw(_:) with this:
super.draw(dirtyRect)

let context = NSGraphicsContext.current()?.cgContext
drawBarGraphInContext(context: context)
Here is where the actual drawing takes place. First, you get the view’s current graphics context by invoking NSGraphicsContext.current(), and then you call the method to draw the bar chart.
Build and run. You’ll see the bar chart in it’s proper position.

Now, open Main.storyboard and select the View Controller scene.
You’ll see this:
Interface Builder now renders the view in real time. You can also change the colors and the view responds to those changes. How awesome is that?
Clipping Areas
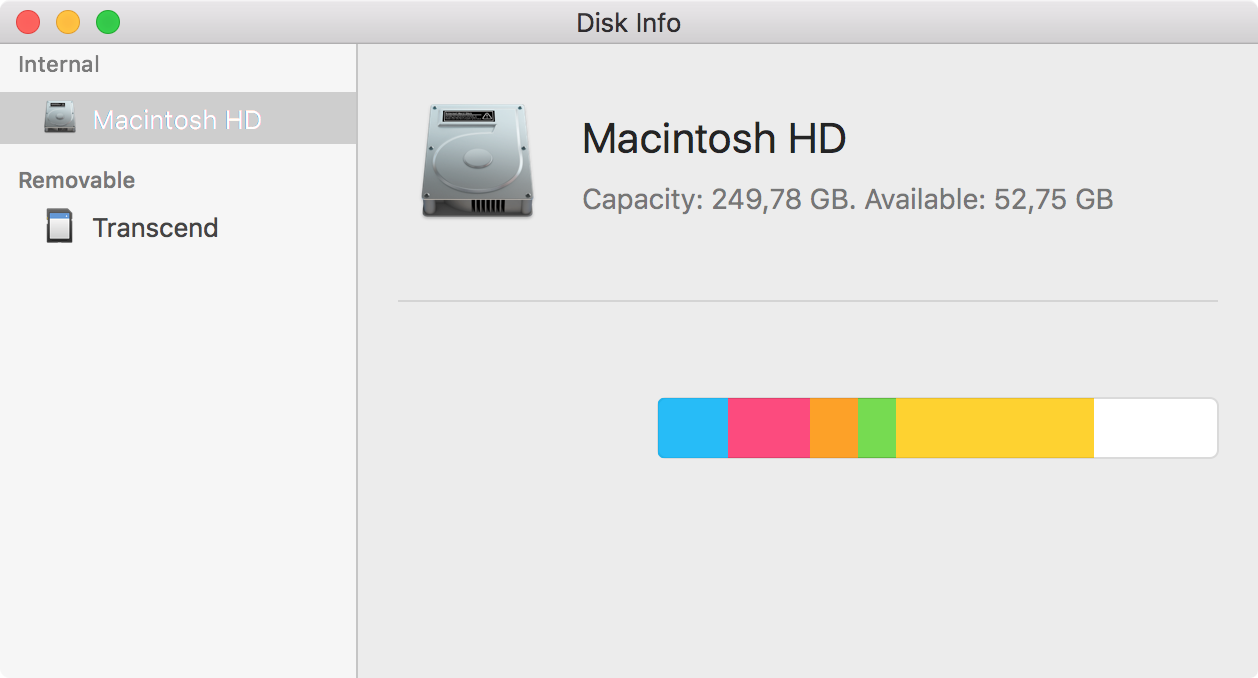
You’re at the part where you make the distribution chart, a bar chart that looks like this:

Take a step back here and dabble in a bit of theory. As you know, each file type has its own color, and somehow, the app needs to calculate each bar’s width based on the corresponding file type’s percentage, and then draw each type with a unique color.
You could create a special shape, such as a filled rectangle with two lines at bottom and top of the rectangle, and then draw it. However, there is another technique that will let you reuse your code and get the same result: clipping areas.
You can think of a clipping area as a sheet of paper with a hole cut out of it, which you place over your drawing: you can only see the part of the drawing which shows through the hole. This hole is known as the clipping mask, and is specified as a path within Core Graphics.
In the case of the bar chart, you can create an identical fully-filled bar for each filetype, and then use a clipping-mask to only display the correct proportion, as shown in the following diagram:

With an understanding of how clipping areas work, you’re ready to make this bar chart happen.
Before drawing, you need to set the value for fileDistribution when a disk is selected. Open Main.storyboard and go to the View Controller scene to create an outlet.
Option-click on ViewController.swift in the Project Navigator to open it in the Assistant Editor, and Control-Drag from the graph view into the view controller class source code to create an outlet for it.

In the popup, name the outlet graphView and click Connect.

Open ViewController.swift and add this code at the end of showVolumeInfo(_:):
graphView.fileDistribution = volume.fileDistribution
This code sets the fileDistribution value with the distribution of the selected disk.
Open GraphView.swift and add this code at the end of drawBarGraphInContext(context:) to draw the bar chart:
// 1
if let fileTypes = fileDistribution?.distribution, let capacity = fileDistribution?.capacity, capacity > 0 {
  var clipRect = barChartRect
  // 2
  for (index, fileType) in fileTypes.enumerated() {
    // 3
    let fileTypeInfo = fileType.fileTypeInfo
    let clipWidth = floor(barChartRect.width * CGFloat(fileTypeInfo.percent))
    clipRect.size.width = clipWidth

    // 4
    context?.saveGState()
    context?.clip(to: clipRect)

    let fileTypeColors = colorsForFileType(fileType: fileType)
    drawRoundedRect(rect: barChartRect, inContext: context,
                    radius: Constants.barChartCornerRadius,
                    borderColor: fileTypeColors.strokeColor.cgColor,
                    fillColor: fileTypeColors.fillColor.cgColor)
    context?.restoreGState()

    // 5
    clipRect.origin.x = clipRect.maxX
  }
}
This is what the code above does:
- Makes sure there is a valid
fileDistribution. - Iterates through all the file types in the distribution.
- Calculates the clipping rect, based on the file type percentage and previous file types.
- Saves the state of the context, sets the clipping area and draws the rectangle using the colors configured for the file type. Then it restores the state of the context.
- Moves the x origin of the clipping rect before the next iteration.
You might wonder why you need to save and restore the state of the context. Remember the painter’s model? Everything you add to the context stays there.
If you add multiple clipping areas, you are in fact creating a clipping area that acts as the unifying force for all of them. To avoid that, you save the state before adding the clipping area, and when you’ve used it, you restore the context to that state, disposing of that clipping area.
At this point, Xcode shows a warning because index is never used. Don’t worry about it for now. You’ll fix it later on.
Build and run, or open Main.storyboard and check it out in Interface Builder.
It’s beginning to look functional. The bar chart is almost finished and you just need to add the legend.