Monitoring HTTP Traffic with Instruments
Learn to monitor and analyze HTTP traffic using Instruments Network profiling in your iOS SwiftUI apps. By Vijay Subrahmanian.
Applying the Code Fix
In DataProvider.swift, find getQOTD(completion:). The intention here is to cancel any ongoing task to fetch a quote before a new one triggers.
Replace dataTaskFetchImage?.cancel with:
dataTaskFetchQuote?.cancel()
To identify the download task, add the taskDescription for the tasks.
At the end of getQOTD(completion:), add the following line before calling dataTaskFetchQuote?.resume():
dataTaskFetchQuote?.taskDescription = "QuoteOfTheDayDownloadTask"
Likewise, add this line to getRandomPicture(completion:) before calling dataTaskFetchImage?.resume:
dataTaskFetchImage?.taskDescription = "RandomImageDownloadTask"
The system doesn’t interpret taskDescription. You can use this value for whatever purpose you see fit. Here, it’ll help you better identify this task in Instruments.
Build and run. Now you’ll see the background picture loads successfully. Yay!
Tap Shuffle and observe.

Notice that the background image keeps shuffling, but the quote remains the same.

Think back to the previous session where you inspected the favqs.com API task.
Notice anything?
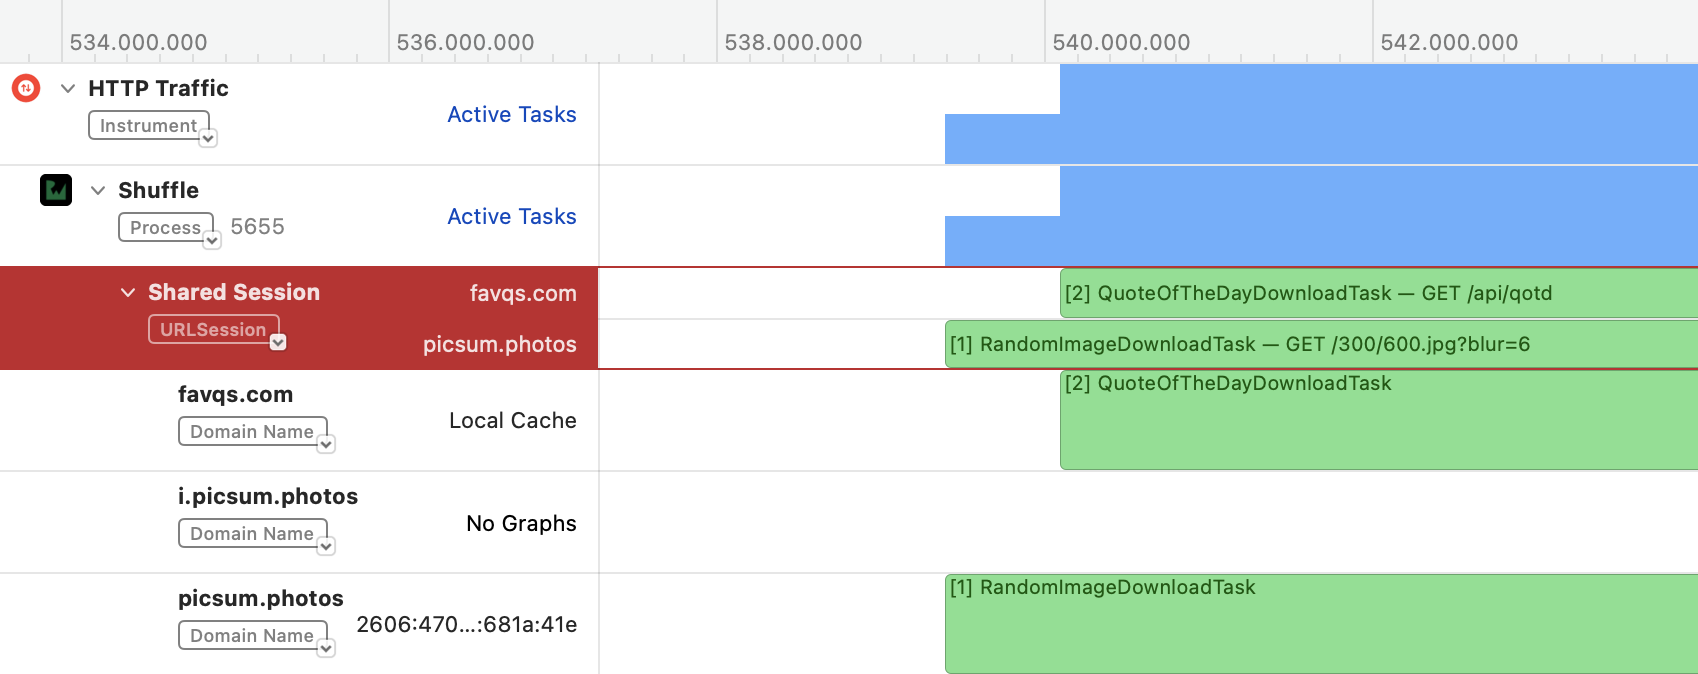
Hint: In HTTP Traffic Instrument > Shuffle > Shared Session, make sure the favqs.com API track is selected. From the filter option in the detail area, select List: HTTP Transactions.
![]()
Notice Cache Lookup! This tells you the API call never went to the web service as there was already a cached response available. The cached data was immediately returned in just a few milliseconds and hence it always showed the same quote. The culprit is this line in getQOTD(completion:):
let urlRequest = URLRequest(url: url, cachePolicy: .returnCacheDataElseLoad)
To fix the issue, replace the line above with:
let urlRequest = URLRequest(
  url: url,
  cachePolicy: .reloadIgnoringLocalAndRemoteCacheData)
By setting .reloadIgnoringLocalAndRemoteCacheData as the cache policy, you ask the URLRequest to always load the data by connecting to the remote web service API.
Build and run. Aha!

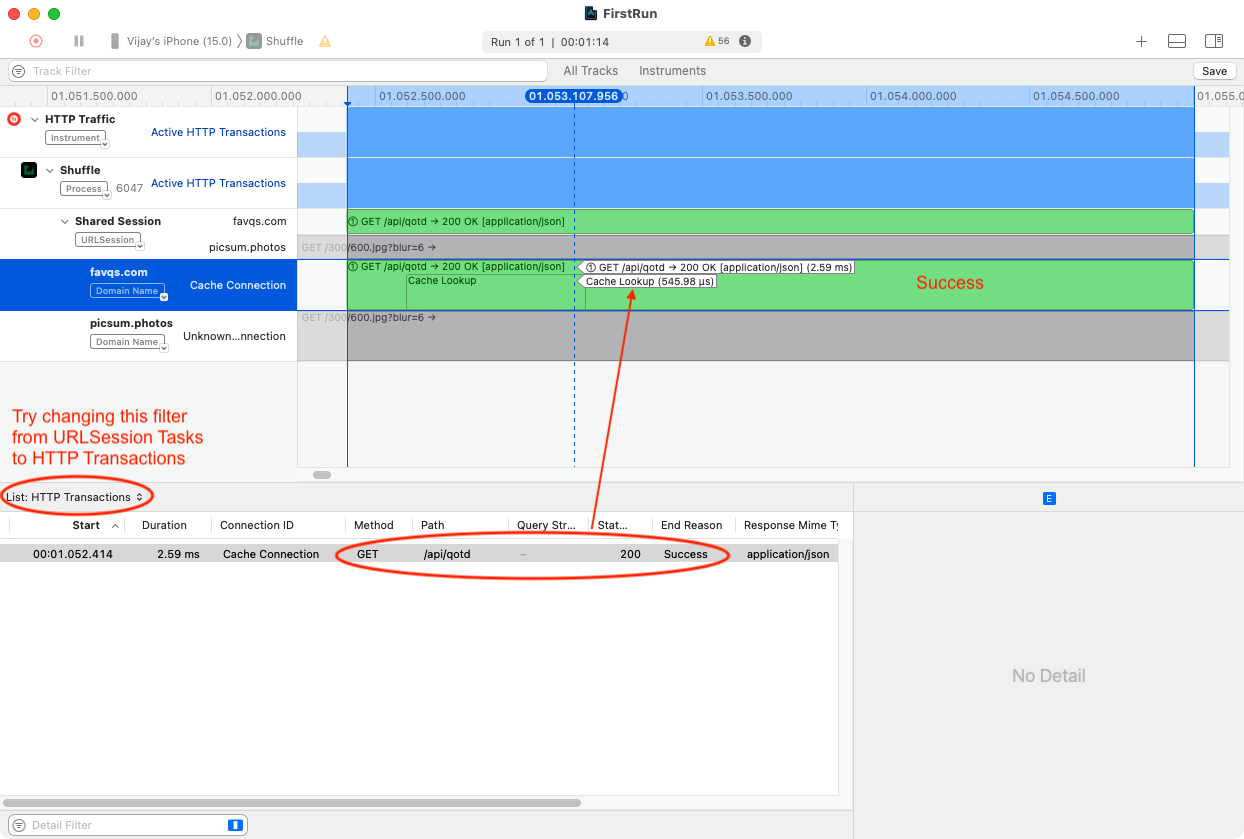
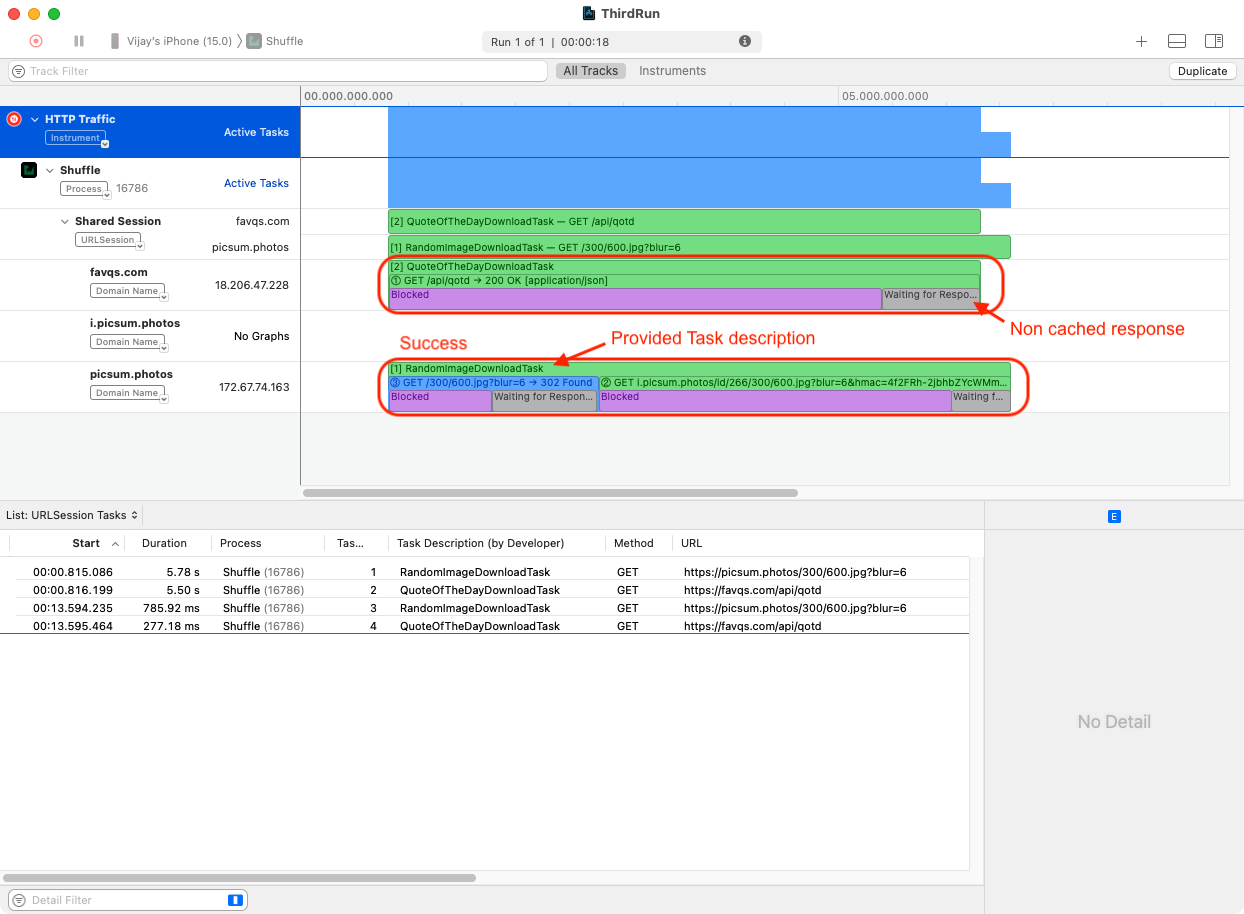
Profile the app again and record the session for the Today tab. Now you’ll see a non-cached response and the task description.
Yay!

The task description RandomImageDownloadTask has a URL redirection before it receives the image. Thus, it has two transactions in one task! Check the detail and inspector areas for more details on the responses from both the transactions.

You can also right-click the task and choose Set Inspection Range and Zoom to zoom on the selected task in the track view.

Next, you’ll inspect a secure API along with its associated cookies in HTTP Track Instrument.
Inspecting an Authentication API
Profile the app and start recording. Then, select the Profile tab and log in. If you didn’t create your own username and password, you can use these:
Username: Shuffleuser
Password: Shuffle123$
Wait for the activity list to load.
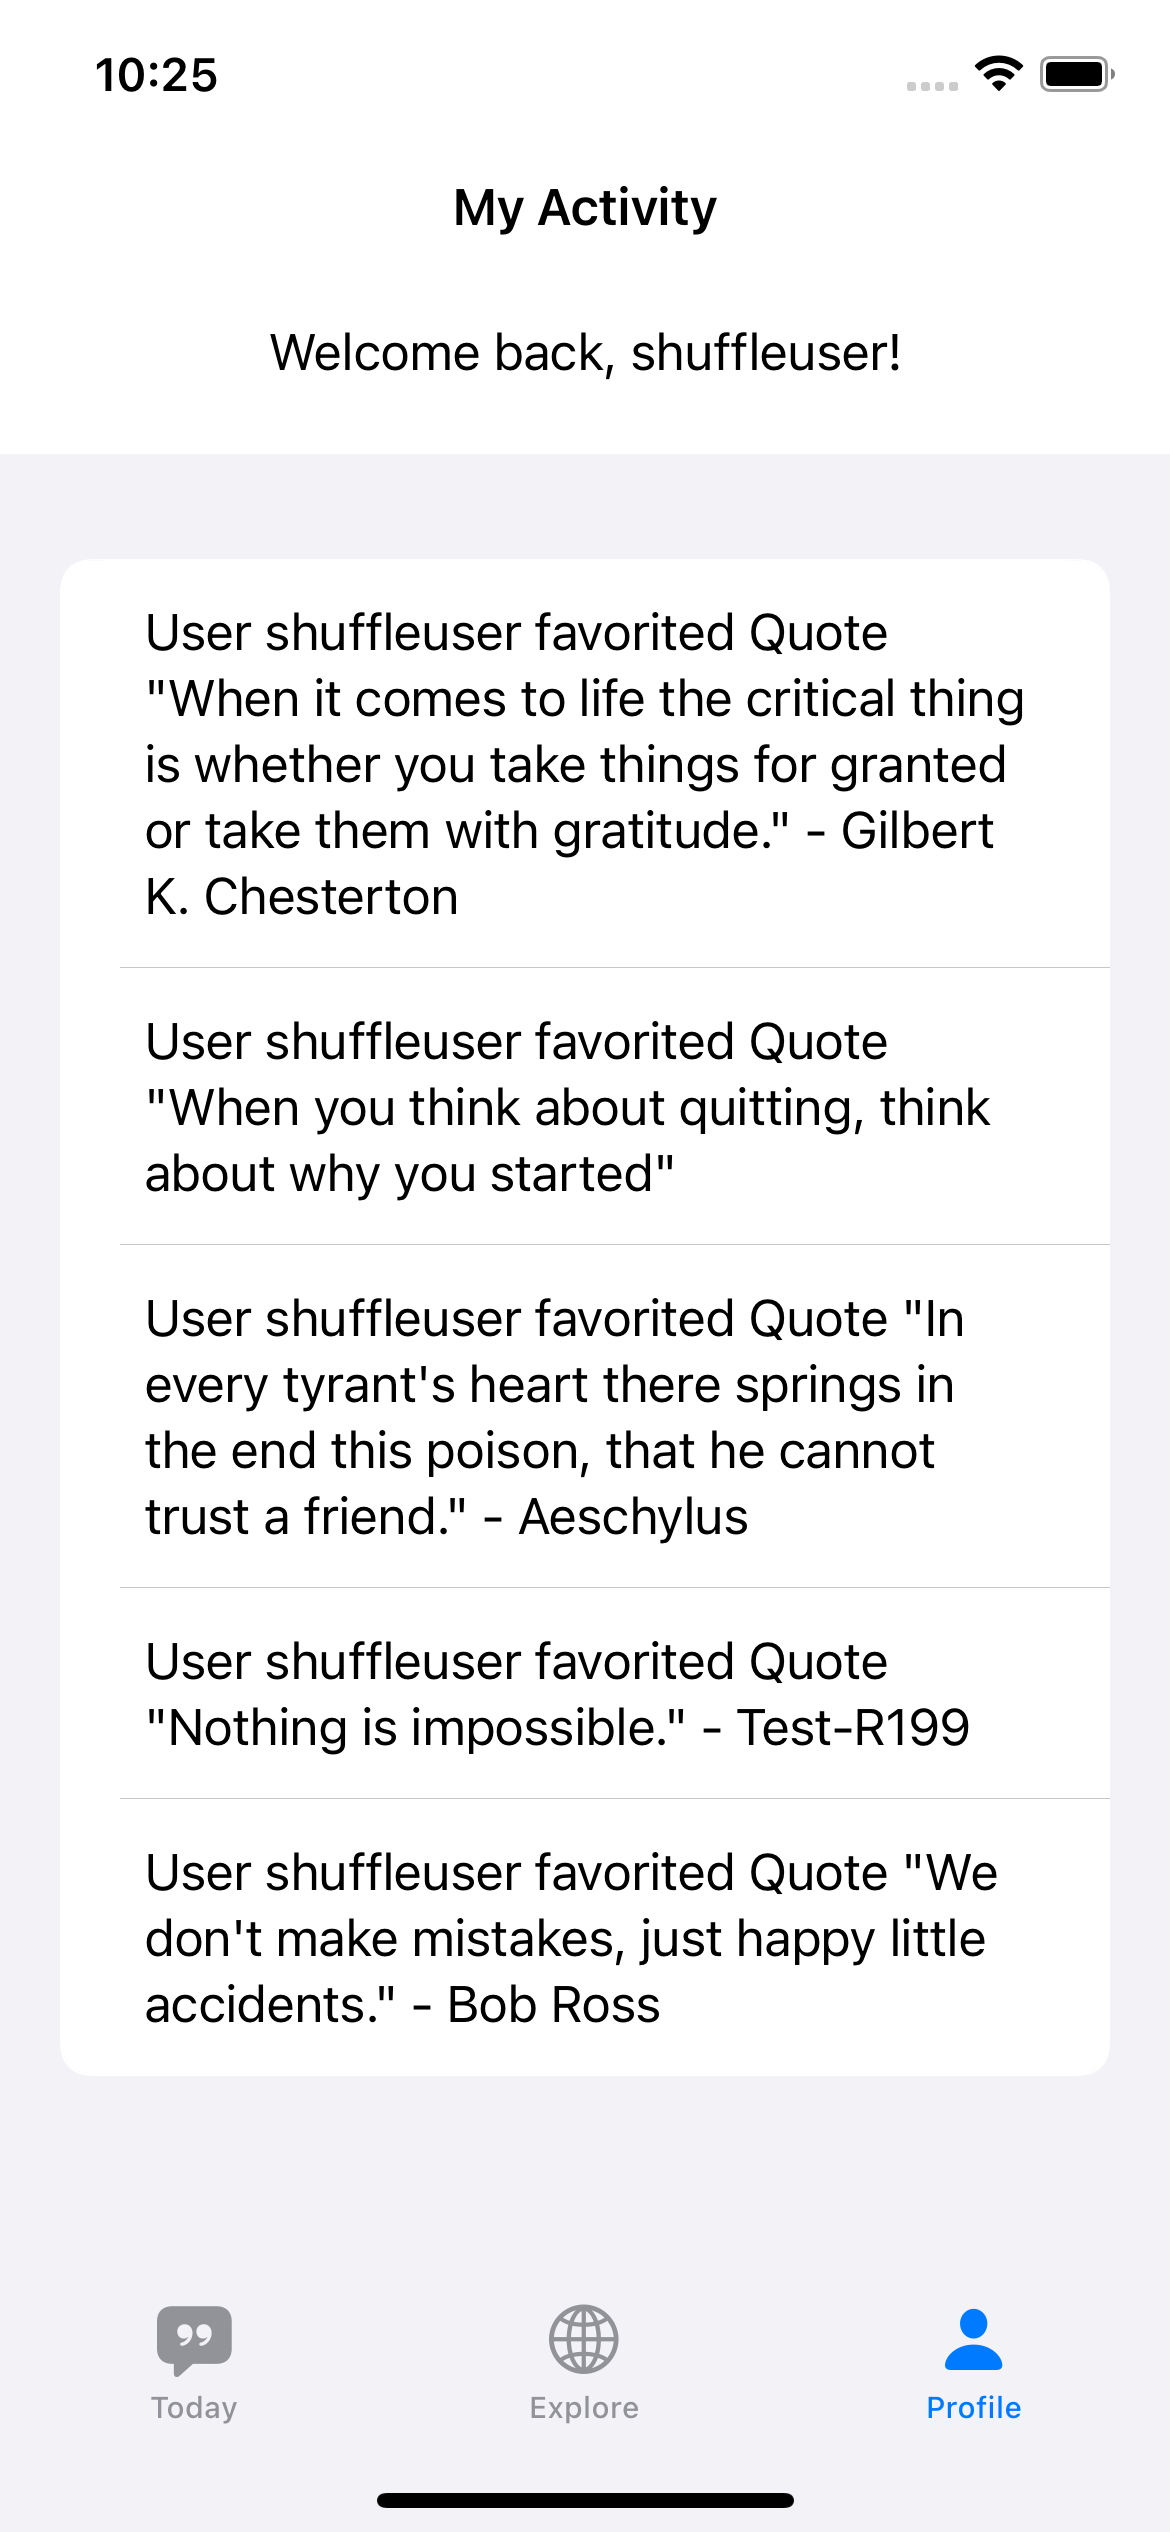
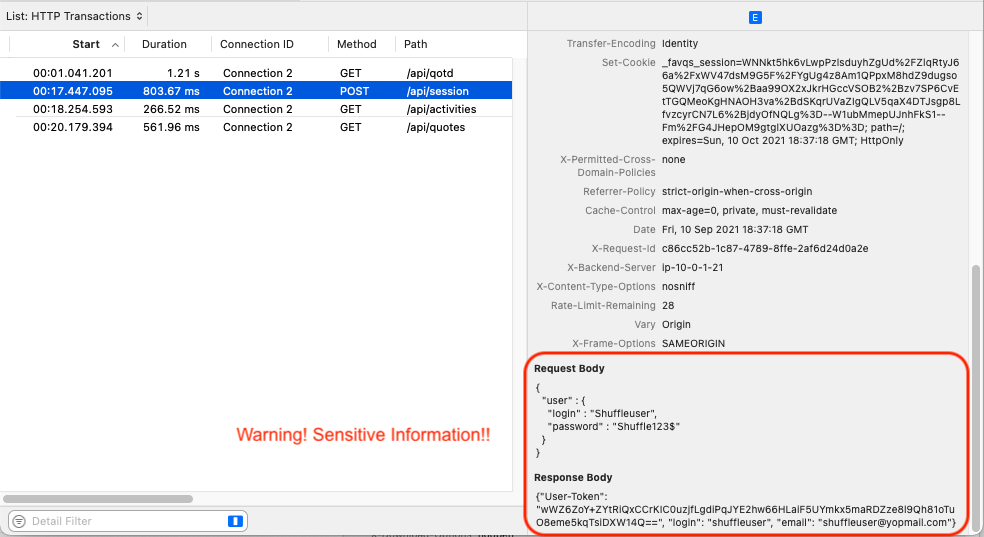
Then, stop the recording and inspect as below. Use the HTTP Transaction filter mode to see the request/response contents in the inspector area.

When you take a closer look at the track, you’ll see the details such as HTTP Method, API Endpoint and Response Code.
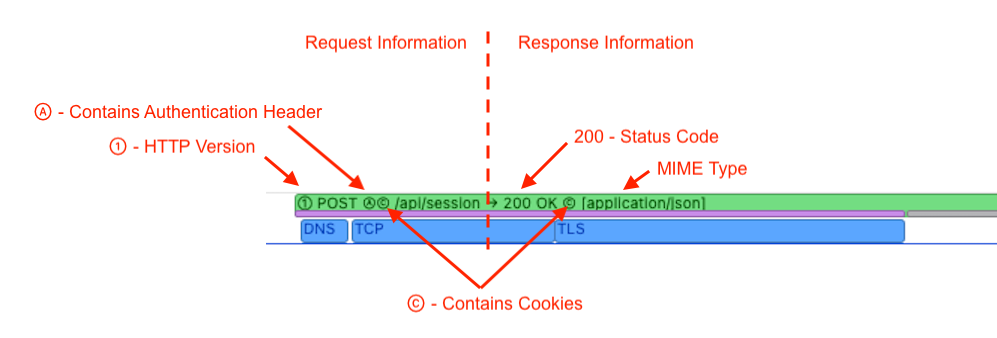
The track also contains symbols that show the HTTP Version used, Authentication header, and if Cookies are being sent/received.
If you don’t see any activity for your user, navigate to the Explore screen in the App. Select a quote and choose bookmark after login.
Generating an HTTP Archive
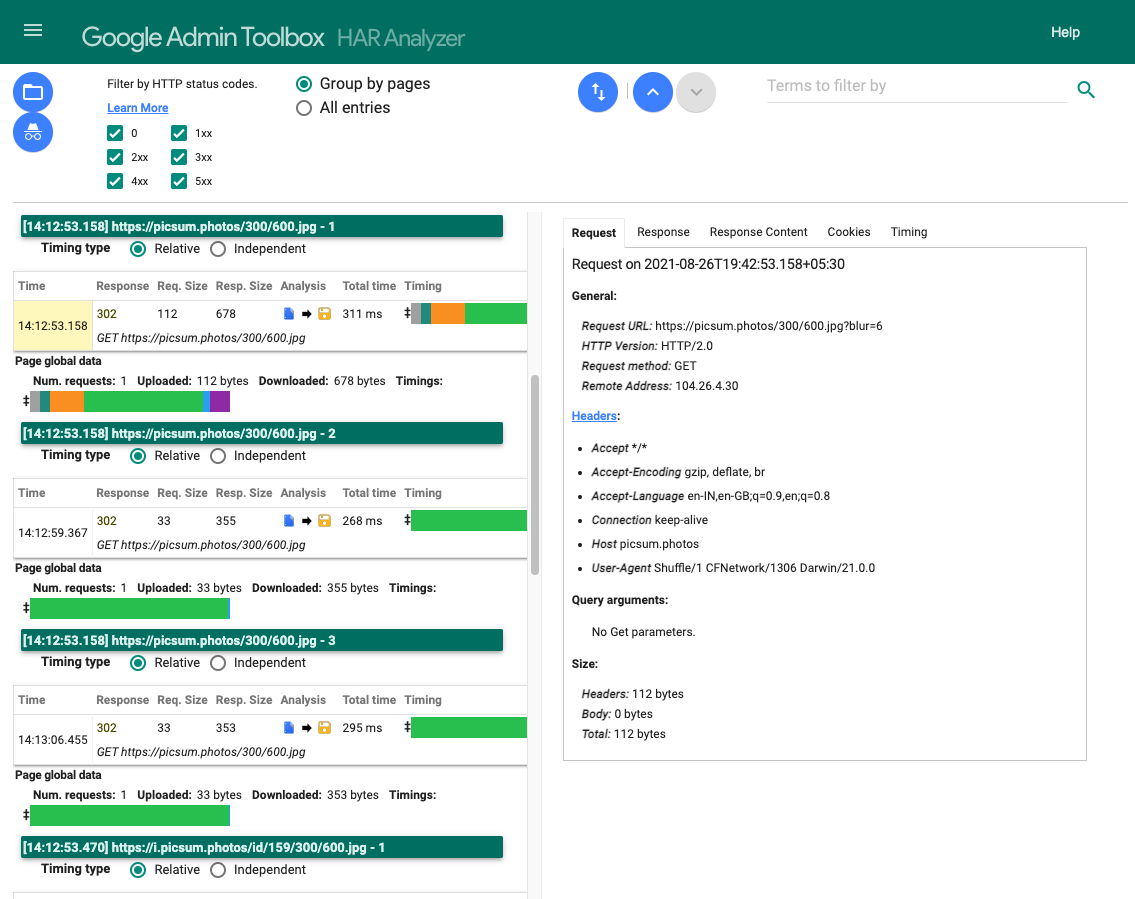
In this tutorial, the issues were at the app level. In real-world projects, while working with web service API integration, often there are problems in the API responses. The HTTP Traffic Instrument lets you export the trace as a HAR file to share the details of your investigation with the web service developers. HAR is a JSON-formatted archive file format for logging an app’s interaction with a web API.
Before exporting, save the recording by selecting File > Save from the Instruments menu.
Once saved, open Terminal. Go to the directory where you saved the .trace file and run the command below.
xcrun xctrace export --input <MySavedSession.trace> --har
This code saves the .har file in the current directory, which you can easily share since it doesn’t require Xcode Instruments to open.
That’s all for this tutorial.
References
Here are a few helpful resources and tutorials to learn more in this area:
WWDC Video 2021 has an excellent introduction to this topic.:
Analyze HTTP traffic in Instruments
This tutorial uses these APIs:
Other Xcode Instrument Tutorials:
- Instruments Tutorial with Swift: Getting Started
- Getting Started with Instruments
- Instruments Help Topics
- Monitor network connections of an iOS app
Refer to these tutorials to learn more on proxy debugging tools:
Other References:
Where to Go From Here?
Download the completed project files by clicking Download Materials at the top or bottom of the tutorial.
In this tutorial, you learned how the HTTP Traffic Instrument works and how you can benefit from it. Try updating the project by adding additional APIs and exploring various options/filters available in the Instruments. Study the information obtained from profiling the app.
We hope you enjoyed this tutorial. If you have any questions, comments or want to show off what you did to improve this project, please join the forum discussion below!