Custom LLDB Commands in Practice
Learn how to use custom LLDB commands to attach to common iOS apps and modify their behavior – all without access to the source code! By Derek Selander.
Welcome to a “special edition” article inspired by our new Advanced Apple Debugging & Reverse Engineering book! This article will showcase the end product of some of the awesome tools you can (and hopefully will) build in the book.
In this article, you’ll explore the SpringBoard application while using some custom LLDB debugging commands and scripts I’ll give you to help aid in understanding this program.
What’s SpringBoard you say? It’s the iOS “homescreen” application responsible for launching iOS applications, Siri (mis)interpreting your latest verbal requests, viewing notifications and widgets, and much much more.
In this tutorial, you’ll explore some logic behind the SpringBoard application and see how to leverage debug scripts to do the heavy lifting for you.
Getting Started
You have a tiny bit of setup to take care of before you get to have some fun.
Download the starter package here. This contains a folder of LLDB commands and scripts which you’ll install on your computer.
LLDB will load content by searching in several predefined locations on your computer. One of them is located at ~/.lldbinit.
Use your favorite text editor and open this file. For this particular example, I’ll just use a simple Terminal text editor nano, but feel free to use your own if it’s more convenient.
-
In
Finder, navigate to the directory you’ve downloaded that contains the lldb_commands directory. Keep this Finder window open for a second as you’ll drag and drop a file into Terminal in a moment. In Terminal, open up the~/.lldbinitusing nano or equivalent.
nano ~/.lldbinit
Then press Enter.

- In nano (or equivalent), type the following:
command script import
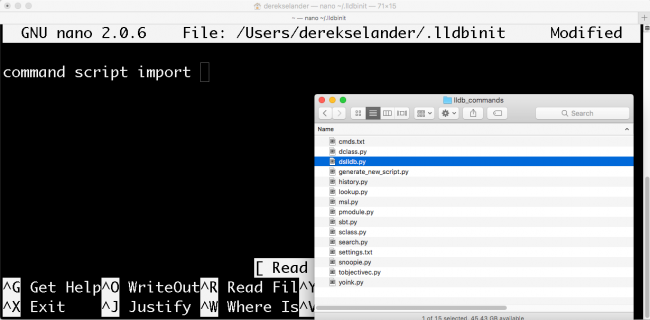
Make sure to add a space at the very end, as you’ll add content from the Finder window now.
- With the Finder window, open the lldb_commands directory, then search for the file called dslldb.py. Drag this file into the Terminal window.

- Save your work and close the text editor. For nano, you press Ctrl + O to save, then Ctrl + X to exit.
In summary, here’s what you should do:

The dslldb.py file will search for all Python files in the same directory and load them into LLDB when it starts up. In addition, it looks for any .txt files and adds those commands in as well. We take a deep dive into this stuff in the book, but for now let’s just enjoy what you can do with these commands.
Testing that Everything Worked
In a new Terminal window, type the following:
lldb
This will launch a blank LLDB session in Terminal. Now type the following:
(lldb) help search
This will consult the help documentation for a new command you’ve added called search. Provided everything went correctly, you’ll get some help text for this command.
If you get something like the following:
(lldb) help search
error: 'search' is not a known command.
Try 'help' to see a current list of commands.
Try 'apropos search' for a list of related commands.
Try 'type lookup search' for information on types, methods, functions, modules, etc.
This means the LLDB commands were not successfully installed. Make sure you have no spaces in the directories you installed the LLDB commands in or surround your path in quotes.
Provided the LLDB commands were successfully installed, you’ll have access to the following commands:
-
search: Enumerate all pointers on the heap for a particular class. Can filter objects by a particular module (i.e.
UIKit) or by a certain condition. - lookup: Perform a regular expression search for classes, functions, or methods.
- msl: Get the stack trace for the last deallocation or allocation event for a particular pointer.
-
methods: Dump all Objective-C methods for an
NSObjectsubclass (iOS only) -
ivars: Dump all instance variables for an Objective-C
NSObjectsubclass instance (iOS only)
These are only a small list of what’s possible with LLDB; you’ll discover some more amusing commands while exploring SpringBoard.
You don’t need that Terminal window anymore so feel free to kill it and jump to Xcode.
Playing With SpringBoard
I often like to see how developers have created something while in production. By exploring what others have done, I can learn from their implementations and write better code myself.
Unfortunately, Apple ain’t gonna open-source any of their iOS apps anytime soon, so I need other ways to learn how they’ve designed their applications. The iOS Simulator provides several functional examples of iOS applications, which I can use along with LLDB to inspect how they’ve been architected.
A lot of people seem to think normal debugging and reverse engineering applications use a different set of debugging skills. I couldn’t disagree with that idea more. Reverse engineering someone else’s application supercharges your debugging skills, which is why I often teach about debugging through reverse engineering. If you can quickly find something of interest without reading a line of source code, imagine how fast you’d be when you’re tasked on finding a bug within your own application?
Attaching to SpringBoard
With LLDB, it’s possible to connect to any application on your computer (provided you have Rootless disabled). Fortunately, you don’t need to have Rootless disabled to attach to the iOS Simulator applications.
This means you can use Xcode to attach to SpringBoard and use all the shortcuts and commands you are accustomed to.
Open up any Xcode application — yes, any. You’re not going to build this actual application, but instead use the existing windows for exploring the SpringBoard application.
Make sure the iOS 10.3 iPhone 7 Plus Simulator is up and running.
Jump to Xcode. In the Debug menu, select Attach to Process, then choose SpringBoard.
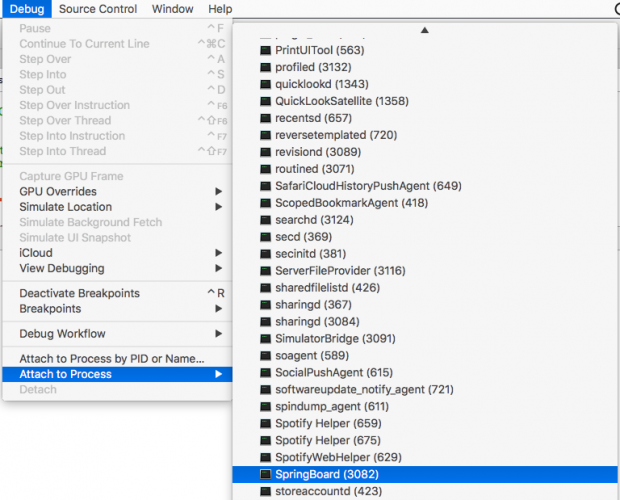
Give LLDB & Xcode a second as it attaches to SpringBoard. When successful, you’ll see a pause button show up on the LLDB console in Xcode. Stop the process by clicking on the pause button in the LLDB console.

You might need to toggle the display of the LLDB console by pressing ⌘ + Shift + Y.
Once the SpringBoard application is paused, type the following into LLDB:
(lldb) dclass
This will dump every single Objective-C class available to the SpringBoard process. As you can see, there’s several classes out there…
dclass -f SwiftObject in LLDB, or Swift-implemented NSObject subclasses by looking for the period in a class name (i.e. dclass -r \\.). If you want to learn the logic behind this, check out Chapter 21 in the book: “Script Bridging with SBValue & Language Contexts”.
Why not filter the dclass command a bit? Dump every class that’s a subclass of UIView that’s available in the process:
(lldb) dclass -f UIView -m SpringBoard
This will limit your query to only the UIView subclasses implemented inside the SpringBoard executable.
There’s still a lot of UIViews. Filter your search to only display classes that contain the case insensitive phrase “image” inside of the class name.
(lldb) dclass -f UIView -m SpringBoard -r (?i)image
This will only display classes whose name contains the case insensitive phrase “image” inside the class name, implemented inside the SpringBoard executable, which are a subclass of UIView. Crazy right?
What’s that weird (?i) all about? In Advanced Apple Debugging & Reverse Engineering, you’ll learn function signatures unique for Objective-C and Swift code and how to perform smart regular expressions to search for any code of interest.
You’ll only get a couple hits for classes:
Dumping all classes in SpringBoard, with filter: UIView
************************************************************
SBDeckSwitcherIconImageContainerView
SBSwitcherSnapshotImageView
SBIconImageView
SBStarkIconImageView
SBLiveIconImageView
SBClockApplicationIconImageView
SBFolderIconImageView
SBIconImageCrossfadeView
SBIconImageFolderCrossfadeView
SBIconImageAppCrossfadeView
SBIconImageAppLowQualityCrossfadeView
SBDarkeningImageView
SBCornerAnimatingImageView
SBAutoPurgingImageView
SBImageAlertView
From the output, let’s go after that SBIconImageView class. Dump all the methods and properties implemented by the SBIconImageView class:
(lldb) methods SBIconImageView
You’ll get something similar to the following truncated output:
<SBIconImageView: 0x10b472258>:
in SBIconImageView:
  Class Methods:
    + (id) viewMap; (0x10aef017d)
    + (unsigned long) viewMap:(id)arg1 maxRecycledViewsOfClass:(Class)arg2; (0x10aef023c)
    + (id) windowForRecycledViewsInViewMap:(id)arg1; (0x10aef0249)
    + (void) recycleIconImageView:(id)arg1; (0x10aef02a0)
    + (id) dequeueRecycledIconImageViewOfClass:(Class)arg1; (0x10aef0312)
    + (double) cornerRadius; (0x10aeef0e1)
This will not only dump the class methods and instance methods, but also the properties implemented by this class and the address in memory of where this code is loaded in memory.
If you wanted to privately use this SBIconImageView class in your own code, you can use dclass to create an Objective-C header for this private class. Type the following in LLDB:
(lldb) dclass -p SBIconImageView
This will generate an Objective-C header file you can plug into your own app to utilize this class.

SBIconImageView class in your own code, you’d need to load the appropriate dynamic library that’s responsible for this class. In the book, this is covered in Chapter 15, “Hooking & Executing Code with dlopen & dlsym”.
Jump back to that SBIconImageView class, wouldn’t it be great to hunt down all the currently-live objects of that class in memory? Well, with the search LLDB command, you can dynamically hunt for all instances of a class on the heap. In LLDB, type the following:
(lldb) search SBIconImageView
You’ll get something similar to the following truncated output:
(lldb) search SBIconImageView
<__NSArrayM 0x618000858270>(
<SBIconImageView: 0x7ff6ad7492f0; frame = (-1 -1; 62 62); userInteractionEnabled = NO; layer = <CALayer: 0x6100002226a0>>,
<SBIconImageView: 0x7ff6b0a78e30; frame = (-1 -1; 62 62); userInteractionEnabled = NO; layer = <CALayer: 0x608000225520>>,
<SBIconImageView: 0x7ff6ad743d90; frame = (-1 -1; 62 62); userInteractionEnabled = NO; layer = <CALayer: 0x610000221700>>,
This is nice, but where are these classes in SpringBoard? You can easily query all these classes and perform a custom action on them with an option from the search command. Type the following:
(lldb) search SBIconImageView -p '[obj setHidden:YES]'
Jump over to the iOS Simulator to see what you’ve just done.

Can you accurately guess what class the SBIconImageView is used for?!
Undo your work by unhiding all of the SBIconImageViews.
(lldb) search SBIconImageView -p '[obj setHidden:NO]'
The search command is nice, but it returned results for all applications — that’s way too many. What if you only wanted to find the SBIconImageView responsible for the Messages application?
Using the methods command, you can search through interesting code that can help you determine how to uniquely identify a particular SBIconImageView.
For example the SBIconImageView has a property named icon, which holds a class called SBApplicationIcon. Dump the methods implemented by this class
(lldb) methods SBApplicationIcon
Inside of this class is a property called displayName. You can use this knowledge to quickly hunt down the SBIconImageView by displayName!
In LLDB, type:
(lldb) search SBIconImageView -c '[[[obj icon] displayName] containsString:@"Messages"]'
This will (hopefully) return only one SBIconImageView whose displayName contains "Messages". You’ll get something similar to the following:
<__NSArrayM 0x618000e5dac0>(
<SBIconImageView: 0x7fb7b567e020; frame = (-1 -1; 62 62); userInteractionEnabled = NO; layer = <CALayer: 0x61000023a660>>
)
Copy the reference to the SBIconImageView. In my case, it’s 0x7fb7b567e020, but your reference address will be different. Toggle the view off with the tv command:
(lldb) tv 0x7fb7b567e020
The images for the Messages application should now disappear:

While you’re at it, check out all the properties that are being referenced for this instance:
(lldb) ivars 0x7fb7b567e020
The ivars as well as the methods command are built off of code already compiled into an iOS executable. You’re just using this code in an applied way while debugging. You’ll learn about ways to search for this kind of code in Chapter 7: “Image”.
In fact, let’s use one of the final commands you build — lookup — which you’ll create in Chapter 22, “SB Examples, Improved Lookup”. This command will search for all code inside an executable for a particular regular expression name.
In LLDB, type the following:
(lldb) lookup Test
This will spit out a LOT of code. You can actually just get the summary of where this code is with the --summary option instead:
(lldb) lookup Test -s
I got something similar to the following truncated output:
1 hits in: AssistantServices
39 hits in: ChatKit
9 hits in: FrontBoard
5 hits in: VideoToolbox
28 hits in: CoreData
7 hits in: MPUFoundation
5 hits in: CoreDuet
2 hits in: BaseBoardUI
7 hits in: MediaServices
5 hits in: PassKitCore
11 hits in: MusicLibrary
16 hits in: Foundation
6 hits in: Sharing
2 hits in: libsqlite3.dylib
8 hits in: PhotoLibrary
Let’s say I wanted to explore only the BaseBoardUI module. I can use the lookup command to filter queries based upon a module:
(lldb) lookup Test -m BaseBoardUI
****************************************************
2 hits in: BaseBoardUI
****************************************************
-[UIView(BaseBoardUI) bs_isHitTestingDisabled]

-[UIView(BaseBoardUI) bs_setHitTestingDisabled:]
This means I can use this code on any UIView within the SpringBoard application! For example, I could type po [[UIApp keyWindow] bs_isHitTestingDisabled] to try this property out.
Something that isn’t in here is any code based upon the SpringBoard application. This is understandable, because the executable’s code is stripped out, and you have no debugging symbol information. This is different for Frameworks, because they need to keep around this information so when loaded, it knows the correct address.
But that really makes me sad that we can’t search the executable using the lookup command.
Wait! Guess what? You can!
Type the following:
(lldb) lookup Test -X
This will use the Objective-C runtime to perform a regular expression search instead of using the DWARF debugging information!
As you can see, there’s a lot of testing code that gets shipped with the final product of SpringBoard. Try this code out:
(lldb) po [[SBTestDataProvider sharedInstance] publish]
Once you resume the application by pressing the resume button or typing continue in LLDB, you’ll see the following pop up!

Yay! Notifications!
So was that a fun debugging session or what?