Beginning Machine Learning with scikit-learn
In this Beginning Machine Learning with scikit-learn tutorial, you’ll learn how to create your own CoreML model and integrate it into your iOS app. By Mikael Konutgan.
With iOS 11, Apple released the Core ML framework which allows you to integrate trained machine learning models into your app. Apple provide a tool to convert many model formats into their .mlmodel format. But how do you create and train a machine learning model in the first place? In this tutorial, you’ll get a head start on creating your own machine learning model with Python using scikit-learn and integrating it into an iOS app via Apple’s Core ML framework. In the process, you’ll learn how to:
- Install popular Python machine learning packages on macOS.
- Create predictive machine learning models.
- Integrate these models into your own iOS apps.
Getting Started
Download the starter project, and build and run it.
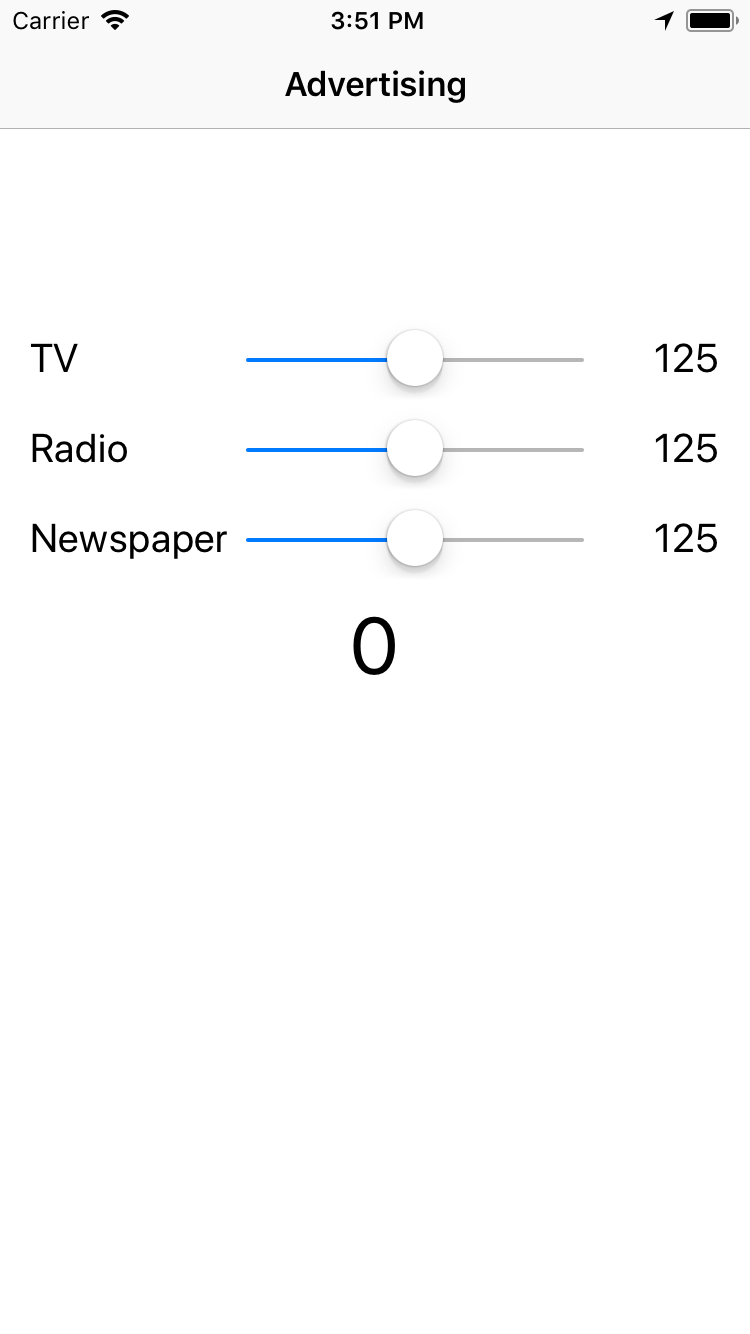
The app has 3 sliders, one for each of the advertising budgets: TV ads, radio ads and newspaper ads. Over the past few years, you’ve recorded the amount spent on advertising (shown in thousands of dollars), as well as the sales you made (shown in thousands of units).
Now you want to build and train a machine learning model to help predict your sales outcomes based on various advertising budget scenarios. Afterwards, you want to conveniently package the model into an iOS app so you and your teams can check outcomes on the fly.
In this tutorial, you’ll build this model and integrate it into the app using Core ML so that when you move any of the sliders, the sales prediction will update.
But first, you’ll need to install the necessary Python tools.
Installing Anaconda
Anaconda is an open source distribution. It contains thousands of preconfigured packages that enable users to get up-and-running quickly with the most popular Data Science and Machine Learning tools in Python.
In this tutorial, you’ll only be scratching the surface of what Anaconda has to offer, so I encourage you to check out anaconda.org to learn more about it.
To install Anaconda, head over to their downloads area, and Download the Python 2.7 version; Apple’s coremltools only work with Python 2.
Once downloaded, run the installer. Continue through the Introduction, Read Me and License until you get to the Destination Select step. The easiest and cleanest way to install Anaconda is into a local project. To do this, select Install on a specific disk…, select the correct disk, click Choose Folder…, navigate into your a user directory of your choosing, and create a new folder called Beginning-Machine-Learning.


After selecting the destination, click Continue, then Install, to begin the installation process. This should take ~10 minutes.
To verify your installation, open Terminal and cd (change directory) into the Beginning-Machine-Learning folder where you installed anaconda. Then, enter the following command:
./anaconda2/bin/python --version
You’ll see a successful response with a Python 2 version, like so:

Congratulations! Python is installed along with its most important data science/machine learning packages.
Installing Core ML Community Tools
One tool that Anaconda doesn’t include is coremltools, an Open Source project from Apple that you’ll use later to convert the scikit-learn model into a format that you can use in your iOS app.
In Terminal, run the following command from the Beginning-Machine-Learning directory:
./anaconda2/bin/pip install -U coremltools

Jupyter Notebook
With everything installed, you’re ready to get started with Jupyter Notebook; think of Jupyter Notebook as Swift Playgrounds, but for Python.
While in the Beginning-Machine-Learning directory, enter the following two commands into Terminal:
mkdir notebooks
./anaconda2/bin/jupyter notebook notebooks
Here, you first created a new folder named notebooks. Then, you started the Jupyter Notebook Server from that new folder.
Your default browser should open up with a Jupyter Notebook page. If not, you’ll see the url of the page in terminal so you can just open it manually; it should look something like this: http://localhost:8888/?token=7609a66aaffa819340a882f8ff88361db3f72667c07c764d.
Now you need to create a new notebook. To do this, click New, then Python 2:

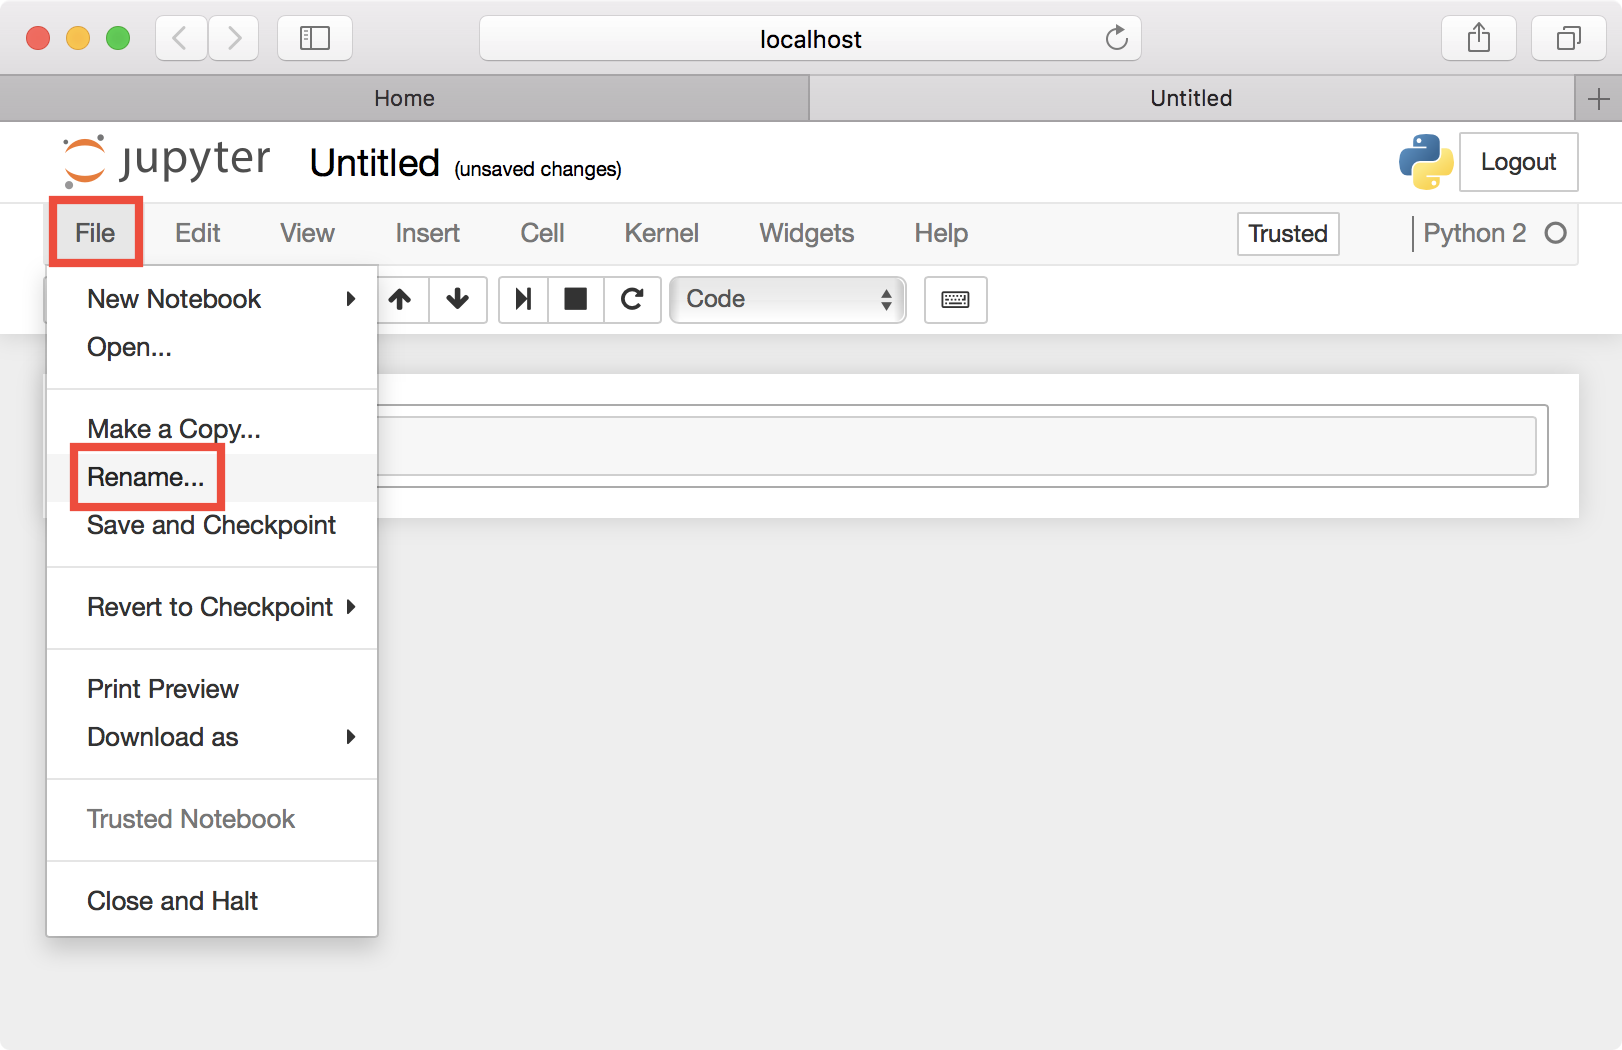
Give the new notebook a better name. Click File, then Rename…, and change the name to Advertising:
Click the floppy disk to save your changes.
Notebooks are a lot like Swift Playgrounds. You can enter Python expressions, then hit Control-Enter to execute them and see the results inline.
Try typing something like 2 + 2 and hitting Control-Enter to get the results. Also, try using Shift+Enter to insert a new cell, as well as executing the current one.
You can also create functions and classes like you would in a normal Python file:

If you want to further understand the interface, check out the User Interface Tour by selecting Help in the menubar.
Once you’re ready, Shift-click the empty space to the left of each cell and use the dd shortcut to delete any cells you made while getting the hang of things.
With a clean notebook, you’re ready for the next step: creating a linear regression model to predict advertising revenue.
Training and Validating a Linear Regression Model
Download this sample advertising data and place the csv file into your notebooks folder.
Now, enter the following code into the first cell of your notebook:
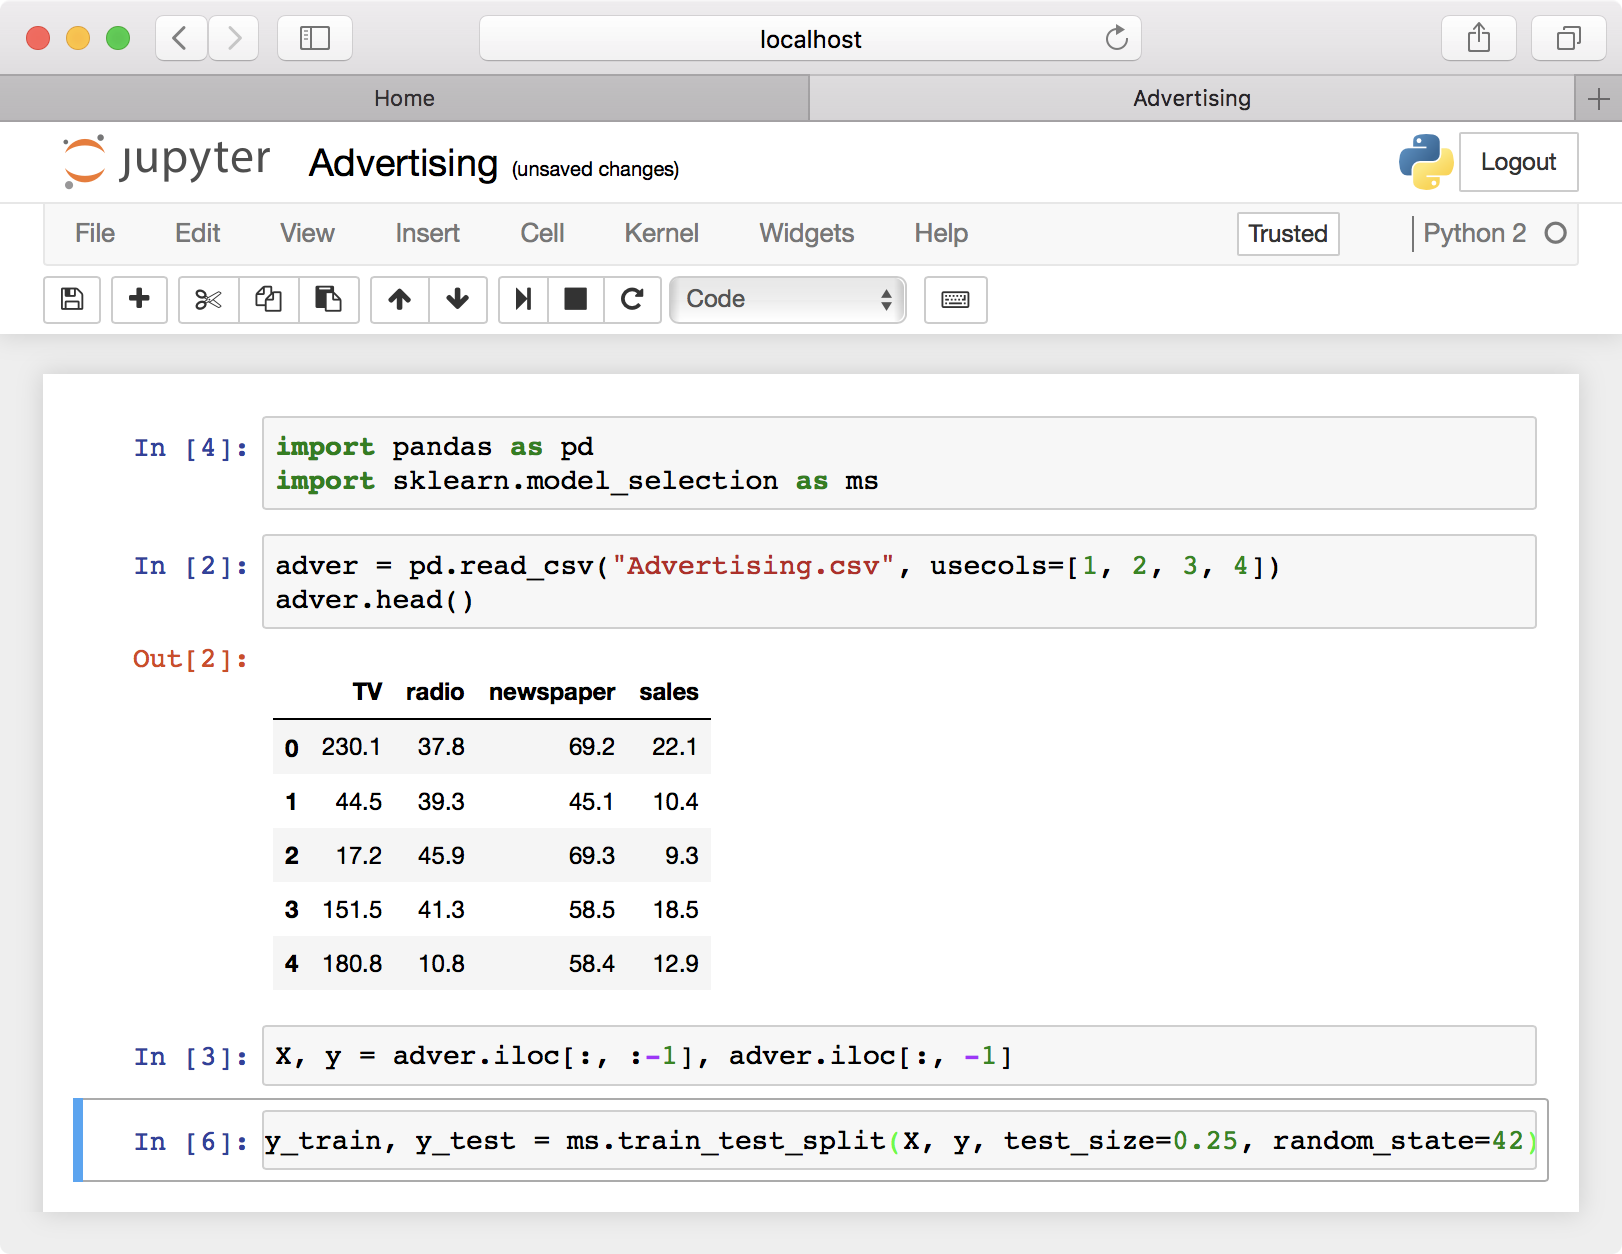
import pandas as pd
Run the cell using Shift-Enter. Then, add the following lines to the second cell and run that cell as well:
adver = pd.read_csv("Advertising.csv", usecols=[1, 2, 3, 4])
adver.head()
First, you imported the pandas library. pandas is a data analysis library with many tools to import, clean and transform data.
Real-world data isn’t ready-to-use like the sample advertising data. You’ll be using pandas to get it into shape for use as inputs into your machine learning model. In the code above, you used it to import the csv file and transform it into pandas’ format — a data frame, which is a standard format most Python machine learning libraries, including scikit-learn, will accept as inputs.
You should see the first few lines of the data in the notebook. Each line represents one data point: how much was spent on TV, radio and newspaper advertising, and the resulting sales for a particular period.

Firstly, you need to separate out the input columns in the data from the output column. By convention, these are called, X and y, respectively. Enter the following code into a new cell and run it:
X, y = adver.iloc[:, :-1], adver.iloc[:, -1]
To properly train and validate a model, you need to split the data into two sets:
- Training set: Used to train the model. These samples are used as inputs into the machine learning algorithms.
- Testing set: Not yet seen by the model, this set is used to test or validate the model. Since the sales for the test set are already known and independent from the training set, the test set can be used to get a score for how well the model was trained using the training set.
Luckily, scikit-learn provides an easy to use function for splitting data into train and test sets. Add the following into the first cell in your notebook, under the pandas import:
import sklearn.model_selection as ms
Make sure that cell has focus, then run it using Control-Enter. Now, at the end of the notebook, type the following into a new cell and run that cell as well:
X_train, X_test, y_train, y_test = ms.train_test_split(X, y, test_size=0.25, random_state=42)
The function returns 4 values: the inputs to use for training and testing, and the outputs to use for training and testing. The function takes the following parameters:
- X: The inputs (spending amounts) that we read in from the Advertisments.csv sample data.
- y: The output (number of sales) also from the sample data.
- test_size: The percentage of the data to use for testing, this is typically set to be anywhere from 25% to 40%.
- random_state: If not entered, the function will randomly select rows to use for the train and test samples. In production, this is exactly what you want, but for development and tutorials like this one, it’s important to get consistent results so you know where to look when things go wrong.
Learn more about the train_test_split function here.
Now that the data is split the way you want, it’s time to create and train a linear regression model from that data.
In the cell that contains the pandas and the sklearn.model_selection imports, append the following import and run the cell:
import sklearn.linear_model as lm
Then, at the bottom of the notebook, enter the following lines into a new cell and run that too:
regr = lm.LinearRegression()  # 1
regr.fit(X_train, y_train)    # 2
regr.score(X_test, y_test)    # 3

- Here, you’re creating a linear regression model object (
regr). - For scikit-learn models, the
fitmethod always trains the model, it takes in the training inputs columns and the output column. - The score is what determines how good the model is. Most scikit-learn models have a score method that takes the test data as parameters. In the case of linear regression, the score gives you a sense of how close the predicted outputs were to the actual outputs from the test data.
You should see the score as 0.89.
Now you can use the linear regression object to predict sales for new input values. To do so, add the following into another cell and run it:
X_new = [[ 50.0, 150.0, 150.0],
         [250.0,  50.0,  50.0],
         [100.0, 125.0, 125.0]]

regr.predict(X_new)

You should see the following output:
array([ 34.15367536, 23.83792444, 31.57473763])
So if you spent $50k, $150k and $150k on marketing for the three platforms, you can expect sales of 34,150 units!
The three steps you used to train a linear regression are the same exact steps you’ll need to use for the vast majority of scikit-learn models.
Next, you’ll use the same three methods to create and train a support vector machine (SVM) model. SVMs are one of the most popular machine learning tools. Because they’re more sophisticated models, they take longer to properly train and tune.